> ## Documentation Index
> Fetch the complete documentation index at: https://domoinc-openapi-sync-dataflows.mintlify.site/llms.txt
> Use this file to discover all available pages before exploring further.

# Flex Map v2 | User Guide

export const InlineImage = ({src, alt = '', height = '1.6em'}) => {
  return <img noZoom src={src} alt={alt} style={{
    display: 'inline',
    verticalAlign: 'start',
    height: height,
    margin: '0'
  }} />;
};

## Intro

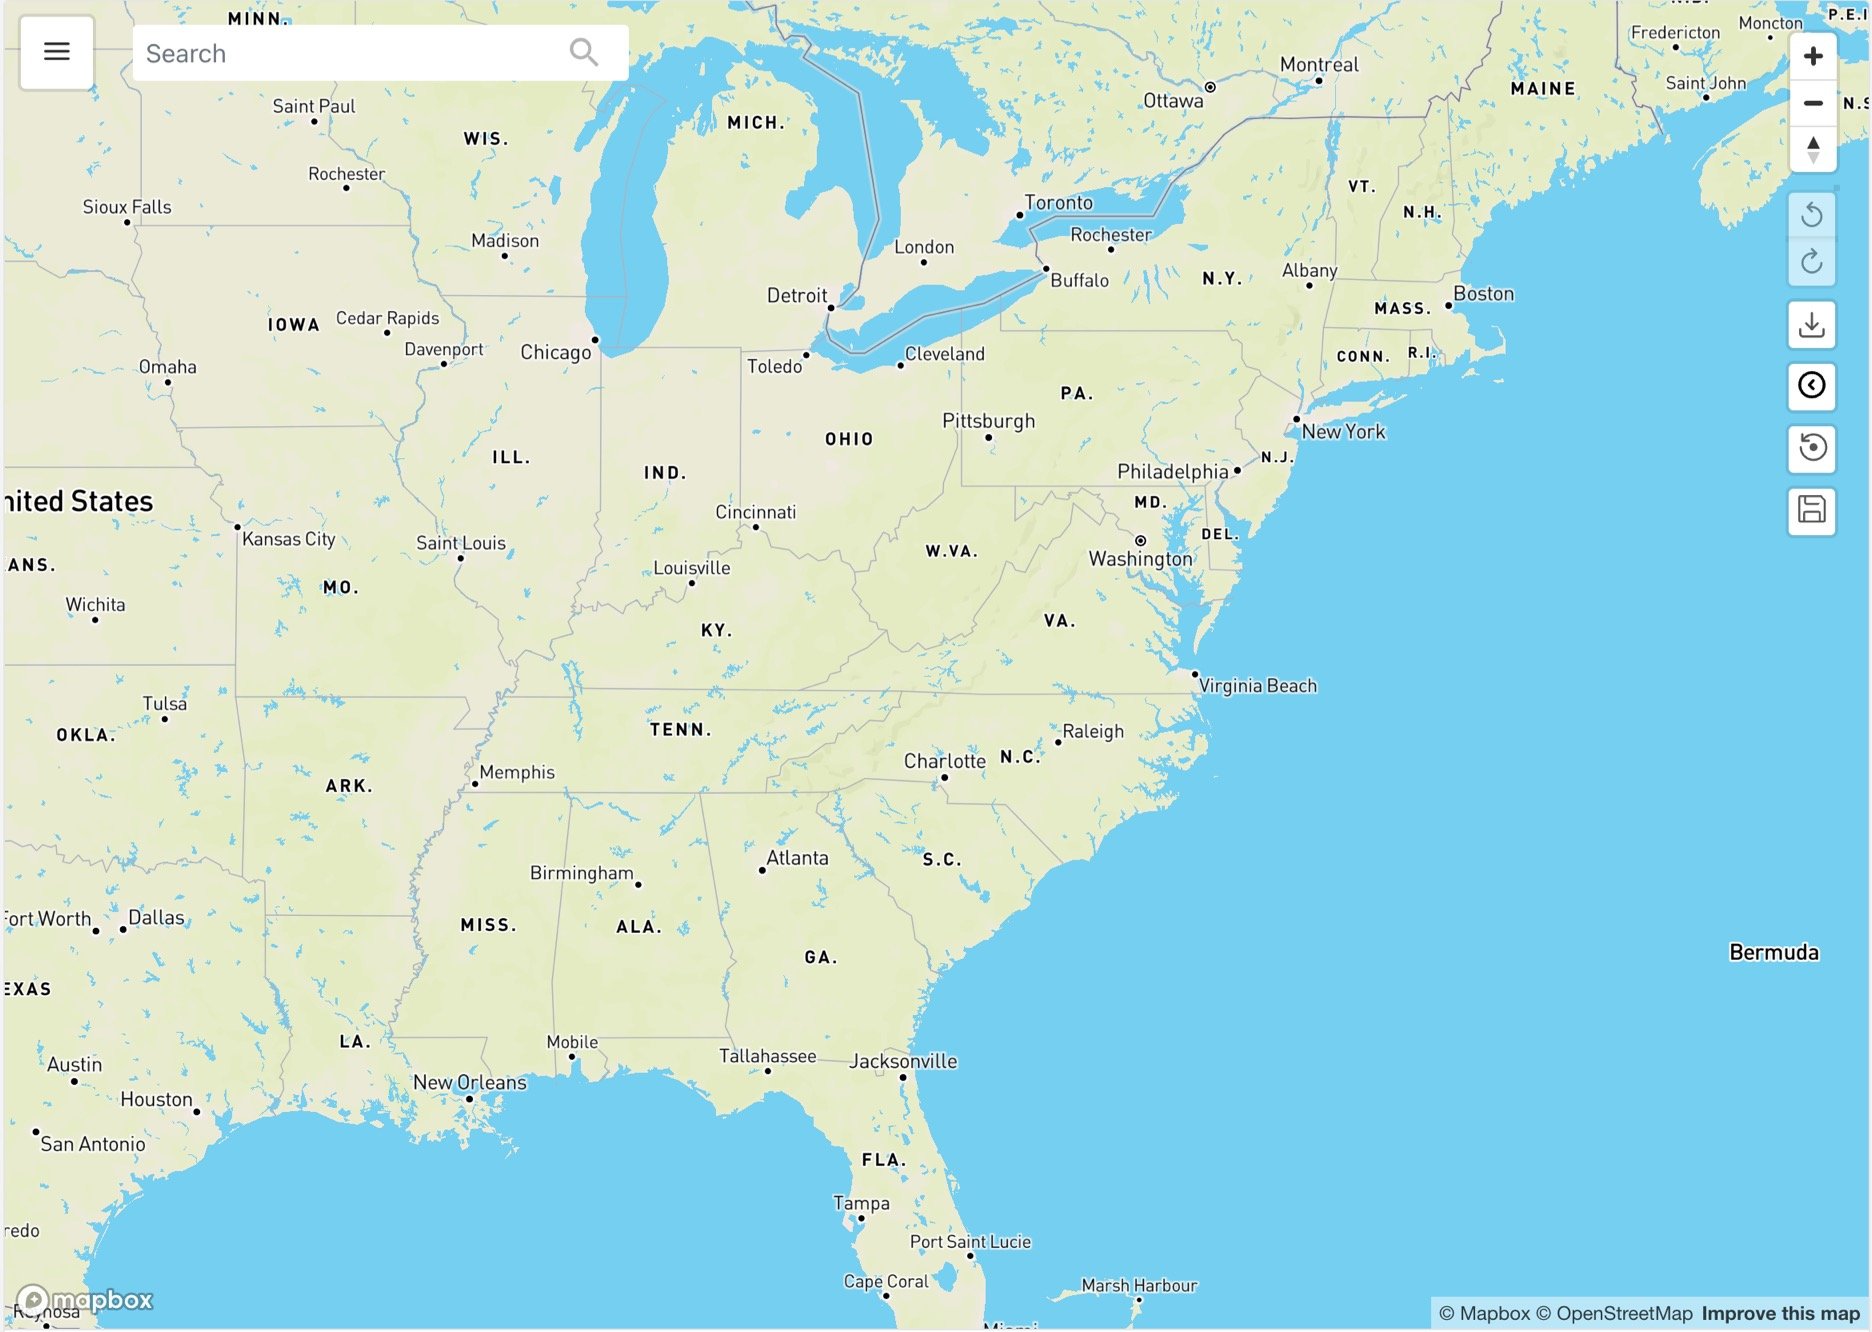
Flex Map v2 is a premium app available in the Appstore. Its main purpose is to display your data in different ways on a map to gain geographical and relational insights from the data. The app can map out various sets of locations and related data for those locations, create and display geographical territories to show the boundaries inside which mapped locations lie, and display heat maps to correlate locations with important metrics or demographics.

Before you begin using the app, make sure you have completed all the required configurations. Learn about these in the [Flex Map v2 Implementation Guide](https://domo-support.domo.com/s/article/000005073).

<Warning>
  **Important:** Flex Map v2 is not the same as Flex Map v1. Learn about how to use that app in the [Flex Map v1 User Guide](http://domo-support.domo.com/s/article/360043438353?language=en_US).
</Warning>

<Frame>
  <img alt="flex map v2.jpg" src="https://mintcdn.com/domoinc-openapi-sync-dataflows/WU9_nv8qBSXeO2YZ/images/kb/ka05w0000012A9e-00N5w00000Ri7BU-0EM5w000006wG2V.jpg?fit=max&auto=format&n=WU9_nv8qBSXeO2YZ&q=85&s=c2a1ec7d9cefa87905c67deeb0b093a5" style={{width: 937, height: 666}} width="1872" height="1332" data-path="images/kb/ka05w0000012A9e-00N5w00000Ri7BU-0EM5w000006wG2V.jpg" />
</Frame>

***

## App Navigation

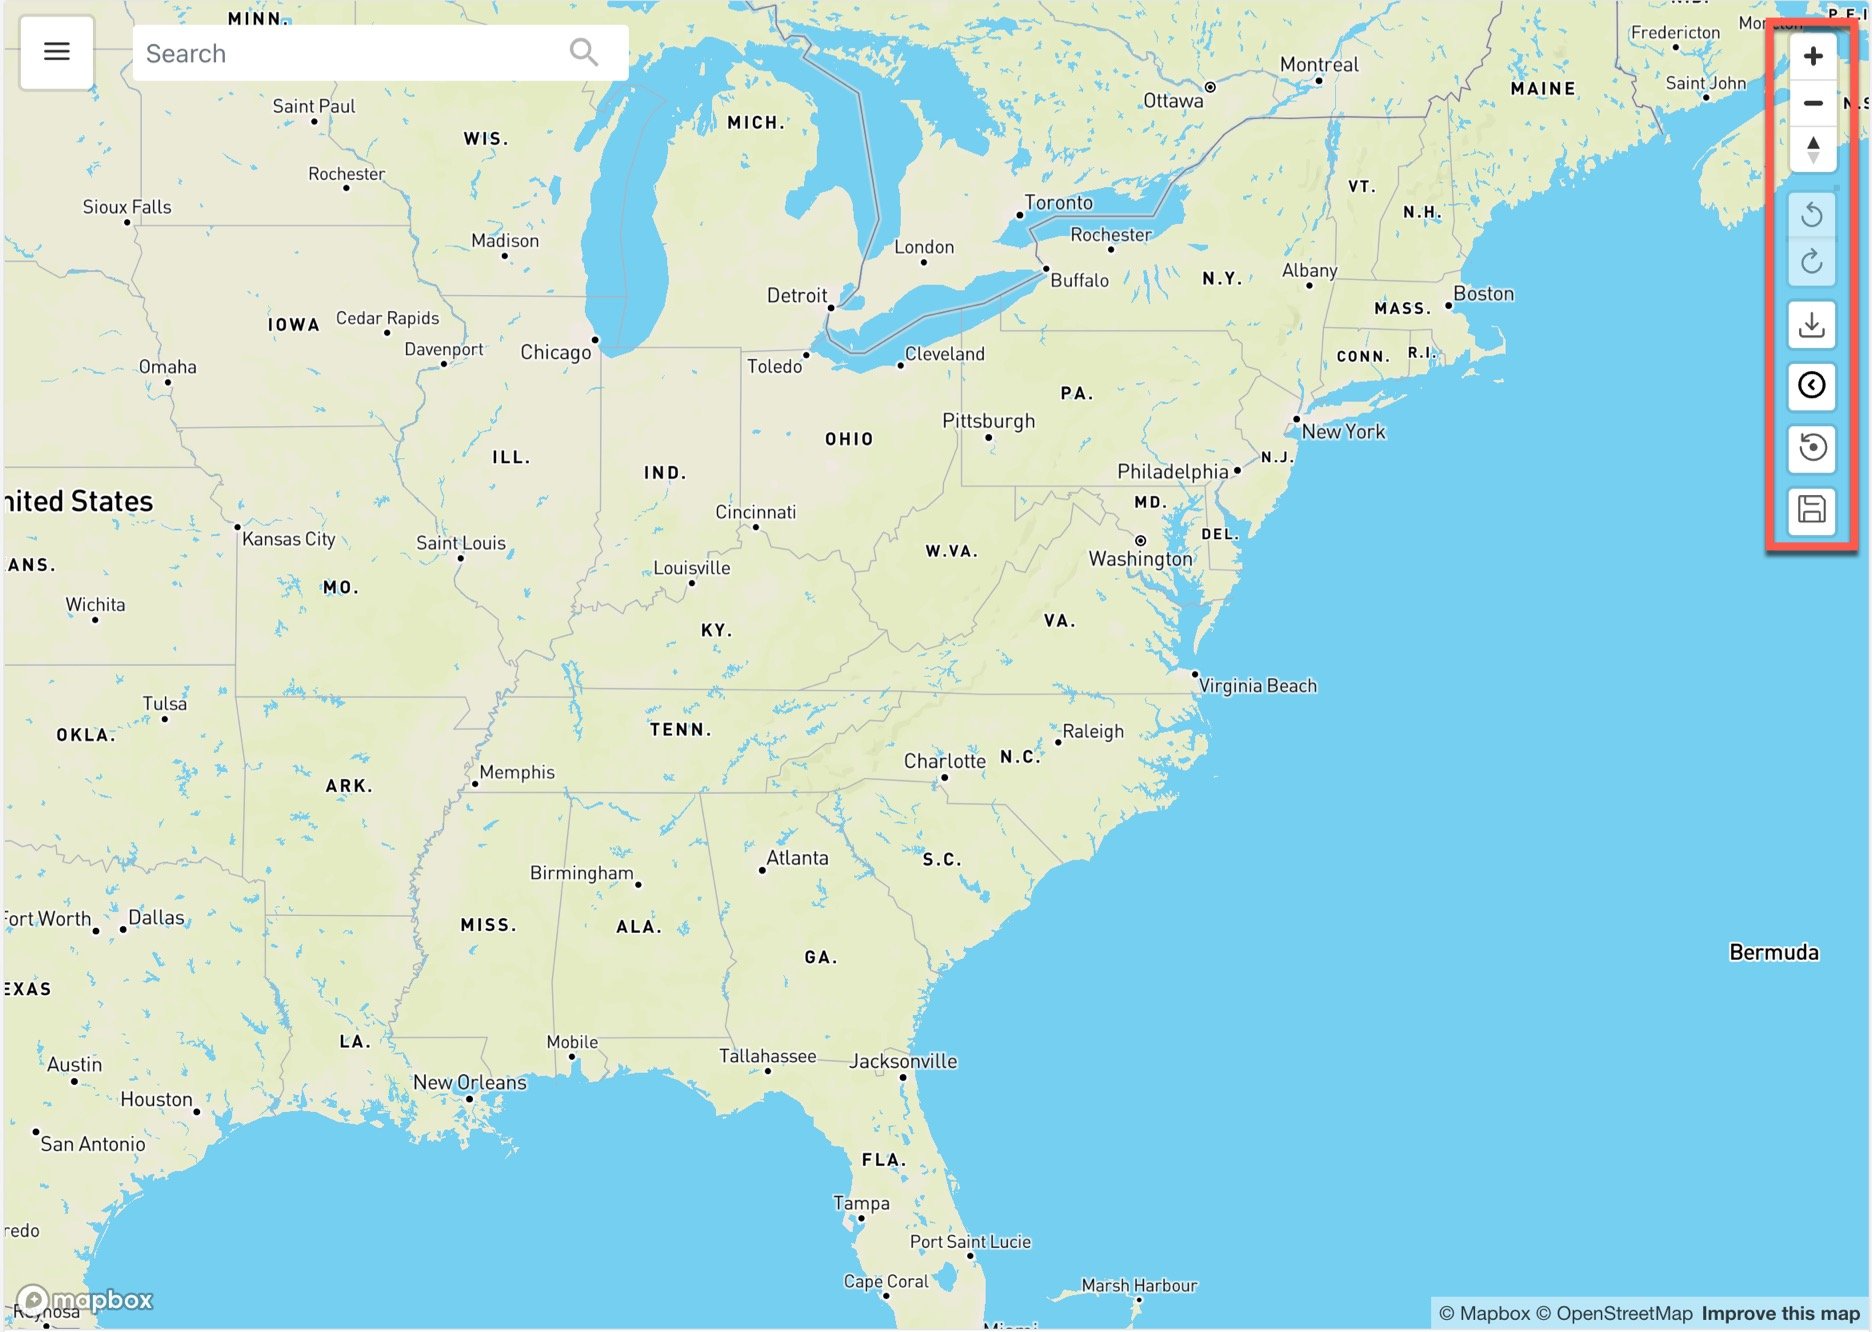
Map controls display on the right side of the screen.
<Frame>
  <img alt="navigation tools.jpg" src="https://mintcdn.com/domoinc-openapi-sync-dataflows/WU9_nv8qBSXeO2YZ/images/kb/ka05w0000012A9e-00N5w00000Ri7BU-0EM5w000006wG2a.jpg?fit=max&auto=format&n=WU9_nv8qBSXeO2YZ&q=85&s=28140d3b2c57042f5eaa13b4957ebd66" style={{width: 833, height: 591}} width="1872" height="1332" data-path="images/kb/ka05w0000012A9e-00N5w00000Ri7BU-0EM5w000006wG2a.jpg" />
</Frame>

The table below describes each of the map controls.

<table border="1" cellpadding="1" cellspacing="1" data-aura-rendered-by="33:201;a"><thead><tr><th colspan="1" rowspan="1"><p> Icon </p></th><th colspan="1" rowspan="1"><p> Tool Description </p></th></tr></thead><tbody><tr><td colspan="1" rowspan="1"><p><img alt="fm zoom.png" src="https://mintcdn.com/domoinc-openapi-sync-dataflows/U7eIF7W20YY38vT9/images/kb/ka05w0000012Aef-00N5w00000Ri7BU-0EM5w000005wAmj.jpg?fit=max&auto=format&n=U7eIF7W20YY38vT9&q=85&s=928b5f7dc8791fc18a3e7a897e85e87d" style={{width: 32, height: 64}} width="58" height="116" data-path="images/kb/ka05w0000012Aef-00N5w00000Ri7BU-0EM5w000005wAmj.jpg" /></p></td><td colspan="1" rowspan="1"><p><b> Zoom in </b> / <b> out — </b> Allows you to adjust the zoom level for the map. </p></td></tr><tr><td colspan="1" rowspan="1"><p><img alt="reset bearing.png" src="https://mintcdn.com/domoinc-openapi-sync-dataflows/U7eIF7W20YY38vT9/images/kb/ka05w0000012Aef-00N5w00000Ri7BU-0EM5w000005wCFX.jpg?fit=max&auto=format&n=U7eIF7W20YY38vT9&q=85&s=851d698f24c948f9115d64510cf815c2" style={{width: 45, height: 45}} width="52" height="52" data-path="images/kb/ka05w0000012Aef-00N5w00000Ri7BU-0EM5w000005wCFX.jpg" /></p></td><td colspan="1" rowspan="1"><p><b> Reset bearing to north — </b> Resets the map's orientation to display north at the top. </p></td></tr><tr><td colspan="1" rowspan="1"><p><img alt="FM undo redo.png" src="https://mintcdn.com/domoinc-openapi-sync-dataflows/U7eIF7W20YY38vT9/images/kb/ka05w0000012Aef-00N5w00000Ri7BU-0EM5w000005wAre.jpg?fit=max&auto=format&n=U7eIF7W20YY38vT9&q=85&s=2d754c0417e84659688e1230ae494114" style={{width: 32, height: 64}} width="58" height="116" data-path="images/kb/ka05w0000012Aef-00N5w00000Ri7BU-0EM5w000005wAre.jpg" /></p></td><td colspan="1" rowspan="1"><p><b> Undo </b> / <b> Redo — </b> Unmakes or remakes a change to the map. </p></td></tr><tr><td colspan="1" rowspan="1"><p><img alt="FM export.png" src="https://mintcdn.com/domoinc-openapi-sync-dataflows/U7eIF7W20YY38vT9/images/kb/ka05w0000012Aef-00N5w00000Ri7BU-0EM5w000005wCEU.jpg?fit=max&auto=format&n=U7eIF7W20YY38vT9&q=85&s=10ff7711daf30aa6e63c8b9035ff87e6" style={{width: 45, height: 45}} width="46" height="46" data-path="images/kb/ka05w0000012Aef-00N5w00000Ri7BU-0EM5w000005wCEU.jpg" /></p></td><td colspan="1" rowspan="1"><p><b> Export — </b> Enables you to export your map as an image, PowerPoint file, or PDF. </p></td></tr><tr><td colspan="1" rowspan="1"><p><img alt="return to default.png" src="https://mintcdn.com/domoinc-openapi-sync-dataflows/U7eIF7W20YY38vT9/images/kb/ka05w0000012Aef-00N5w00000Ri7BU-0EM5w000005wCEK.jpg?fit=max&auto=format&n=U7eIF7W20YY38vT9&q=85&s=cee182e5dfa0f90b6905637cc9fa6b0c" style={{width: 45, height: 45}} width="50" height="50" data-path="images/kb/ka05w0000012Aef-00N5w00000Ri7BU-0EM5w000005wCEK.jpg" /></p></td><td colspan="1" rowspan="1"><p><b> Return to default — </b> Returns the map to its default settings. </p></td></tr><tr><td colspan="1" rowspan="1"><p><img alt="clear map.png" src="https://mintcdn.com/domoinc-openapi-sync-dataflows/U7eIF7W20YY38vT9/images/kb/ka05w0000012Aef-00N5w00000Ri7BU-0EM5w000005wCEo.jpg?fit=max&auto=format&n=U7eIF7W20YY38vT9&q=85&s=df0221367b72916343ddd5644fd4438c" style={{width: 45, height: 45}} width="52" height="48" data-path="images/kb/ka05w0000012Aef-00N5w00000Ri7BU-0EM5w000005wCEo.jpg" /></p></td><td colspan="1" rowspan="1"><p><b> Clear Map — </b> Clears the map of all layers. </p></td></tr><tr><td colspan="1" rowspan="1"><p><img alt="FM save.png" src="https://mintcdn.com/domoinc-openapi-sync-dataflows/U7eIF7W20YY38vT9/images/kb/ka05w0000012Aef-00N5w00000Ri7BU-0EM5w000005wCF3.jpg?fit=max&auto=format&n=U7eIF7W20YY38vT9&q=85&s=f4a4fff59f0edd18a1adceca3c5b2644" style={{width: 32.9948, height: 31.9948}} width="54" height="46" data-path="images/kb/ka05w0000012Aef-00N5w00000Ri7BU-0EM5w000005wCF3.jpg" /></p></td><td colspan="1" rowspan="1"><p><b> Save Map — </b> Saves the current map configuration. </p></td></tr></tbody></table>

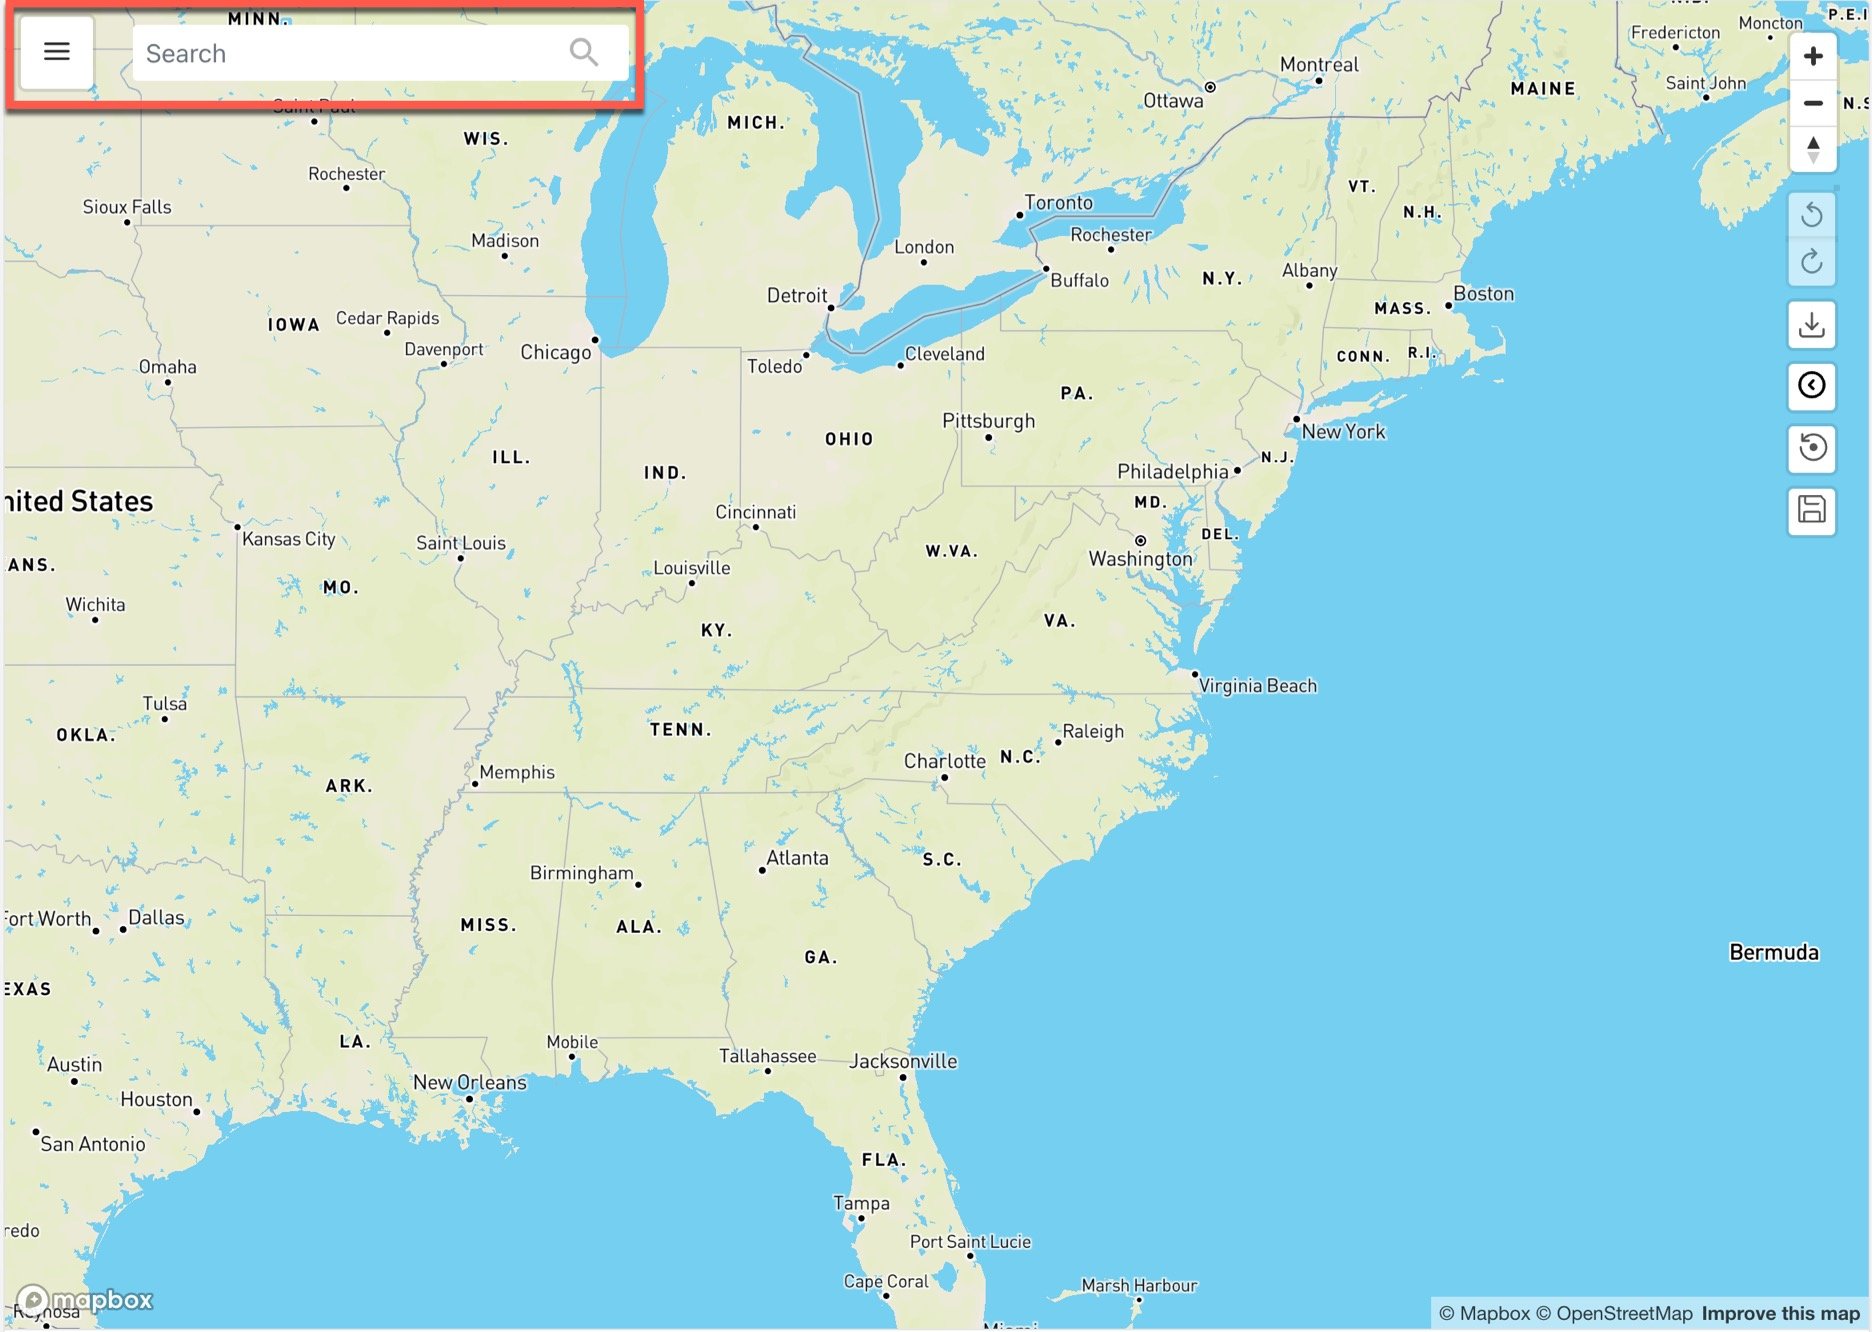
At the top of the screen are the main menu and the search bar.

<Frame>
  <img alt="flex map v2 (1).jpg" src="https://mintcdn.com/domoinc-openapi-sync-dataflows/WU9_nv8qBSXeO2YZ/images/kb/ka05w0000012A9e-00N5w00000Ri7BU-0EM5w000006wG34.jpg?fit=max&auto=format&n=WU9_nv8qBSXeO2YZ&q=85&s=53eac5432ce7978c55a898aa2f4bd0da" style={{width: 707, height: 502}} width="1872" height="1332" data-path="images/kb/ka05w0000012A9e-00N5w00000Ri7BU-0EM5w000006wG34.jpg" />
</Frame>

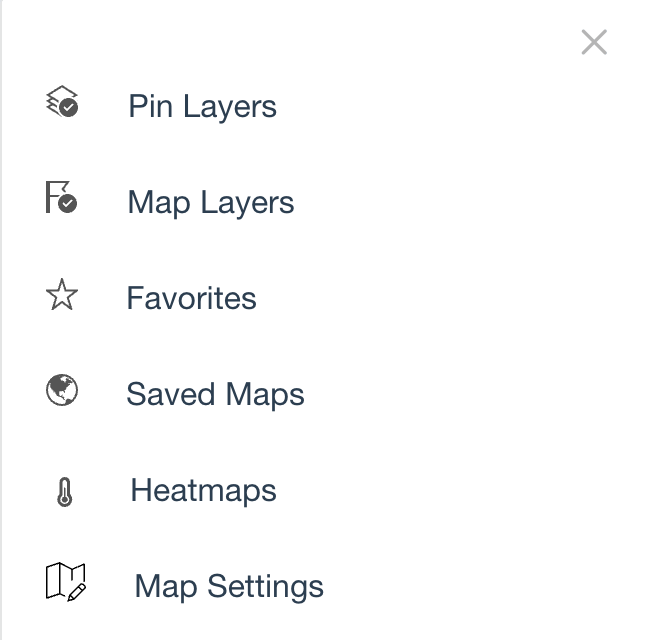
You can access most of the app's features from the main menu, by opening the hamburger menu. Each feature is described later in this guide.
<Frame>
  <img alt="Screen Shot 2022-12-07 at 4.04.49 PM.png" src="https://mintcdn.com/domoinc-openapi-sync-dataflows/WU9_nv8qBSXeO2YZ/images/kb/ka05w0000012A9e-00N5w00000Ri7BU-0EM5w000006wG3E.jpg?fit=max&auto=format&n=WU9_nv8qBSXeO2YZ&q=85&s=be4a2ad101b61d4551cd239ad8cfee22" style={{width: 298.995, height: 297}} width="646" height="640" data-path="images/kb/ka05w0000012A9e-00N5w00000Ri7BU-0EM5w000006wG3E.jpg" />
</Frame>

* After you open the main menu, you can
  <InlineImage src="/images/kb/ka05w0000012Aef-00N5w00000Ri7BU-0EM5w000005wEYR.jpg" /> **Close** it to return to the default screen.
* After you open any feature, you can
  <InlineImage src="/images/kb/ka05w0000012Aef-00N5w00000Ri7BU-0EM5w000005wEeF.jpg" /> **Expand** or <InlineImage src="/images/kb/ka05w0000012Aef-00N5w00000Ri7BU-0EM5w000005wEeK.jpg" /> **Collapse** the feature interface or <InlineImage src="/images/kb/ka05w0000012Aef-00N5w00000Ri7BU-0EM5w000005wEYR.jpg" /> **Close** it to return to the default screen.
* Use the search bar to find locations from your connected data and display them temporarily on the map so you can favorite them. Learn more about
  [Favorites](#favorites) below.

## Pin Layers

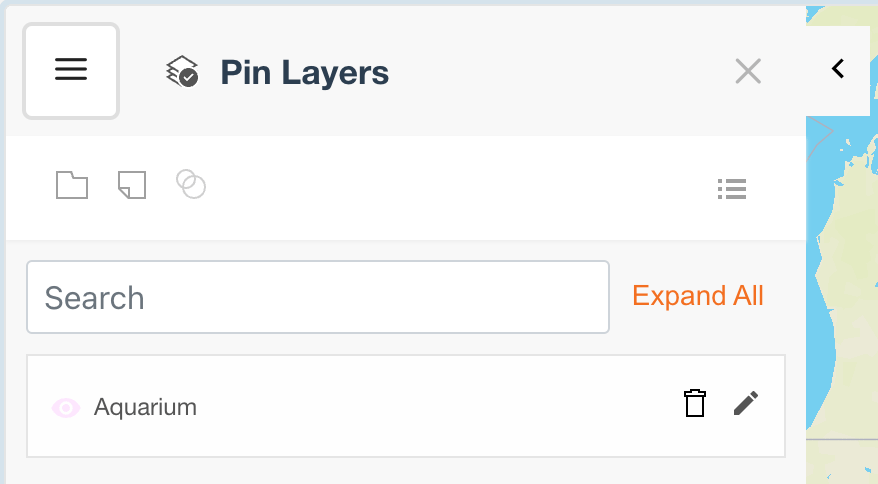
In the main menu, select **Pin Layers** to open the search interface.

<Frame>
  <img alt="Screen Shot 2022-12-07 at 4.11.57 PM.png" src="https://mintcdn.com/domoinc-openapi-sync-dataflows/WU9_nv8qBSXeO2YZ/images/kb/ka05w0000012A9e-00N5w00000Ri7BU-0EM5w000006wG22.jpg?fit=max&auto=format&n=WU9_nv8qBSXeO2YZ&q=85&s=0cedb442655e9c332c71f60b2665855f" style={{width: 560.987, height: 308.999}} width="878" height="484" data-path="images/kb/ka05w0000012A9e-00N5w00000Ri7BU-0EM5w000006wG22.jpg" />
</Frame>

Here, you can create Layers, a subset of the locations data connected to the app.

The following table describes the tools in the **Pin Layers** menu:

<Frame>
  <img alt="pin layers menu.png" src="https://mintcdn.com/domoinc-openapi-sync-dataflows/WU9_nv8qBSXeO2YZ/images/kb/ka05w0000012A9e-00N5w00000Ri7BU-0EM5w000006wG3d.jpg?fit=max&auto=format&n=WU9_nv8qBSXeO2YZ&q=85&s=eab3595351a9aa61a379323421d9cdef" style={{width: 396, height: 53}} width="802" height="108" data-path="images/kb/ka05w0000012A9e-00N5w00000Ri7BU-0EM5w000006wG3d.jpg" />
</Frame>

<table border="1" cellpadding="1" cellspacing="1" data-aura-rendered-by="33:201;a"><thead><tr><th colspan="1" rowspan="1"><p> Icon </p></th><th colspan="1" rowspan="1"><p> Tool Description </p></th></tr></thead><tbody><tr><td colspan="1" rowspan="1"><p><img alt="Screen Shot 2022-12-07 at 4.09.27 PM.png" src="https://mintcdn.com/domoinc-openapi-sync-dataflows/U7eIF7W20YY38vT9/images/kb/ka05w0000012Aef-00N5w00000Ri7BU-0EM5w000005wEfD.jpg?fit=max&auto=format&n=U7eIF7W20YY38vT9&q=85&s=a9513198ee16505a3c0c92c55d877702" style={{width: 32.9972, height: 31.9886}} width="68" height="64" data-path="images/kb/ka05w0000012Aef-00N5w00000Ri7BU-0EM5w000005wEfD.jpg" /></p></td><td colspan="1" rowspan="1"><p><b> Group — </b> Creates a new group. </p></td></tr><tr><td colspan="1" rowspan="1"><p><img alt="Screen Shot 2022-12-07 at 4.09.32 PM.png" src="https://mintcdn.com/domoinc-openapi-sync-dataflows/U7eIF7W20YY38vT9/images/kb/ka05w0000012Aef-00N5w00000Ri7BU-0EM5w000005wEfN.jpg?fit=max&auto=format&n=U7eIF7W20YY38vT9&q=85&s=745893f93f7b24fc6423de8c975507ad" style={{width: 32.9972, height: 31.9886}} width="60" height="56" data-path="images/kb/ka05w0000012Aef-00N5w00000Ri7BU-0EM5w000005wEfN.jpg" /></p></td><td colspan="1" rowspan="1"><p><b> Item — </b> Creates a new item. </p></td></tr><tr><td colspan="1" rowspan="1"><p><img alt="Screen Shot 2022-12-07 at 4.09.40 PM.png" src="https://mintcdn.com/domoinc-openapi-sync-dataflows/U7eIF7W20YY38vT9/images/kb/ka05w0000012Aef-00N5w00000Ri7BU-0EM5w000005wEfX.jpg?fit=max&auto=format&n=U7eIF7W20YY38vT9&q=85&s=fb4e2fcaef43682708d6111b6419299b" style={{width: 45, height: 45}} width="62" height="72" data-path="images/kb/ka05w0000012Aef-00N5w00000Ri7BU-0EM5w000005wEfX.jpg" /></p></td><td colspan="1" rowspan="1"><p><b> Clone — </b> Copies the currently selected Pin Layer. The copied layer displays at the bottom of the Pin Layer list, with the name formatted as <em> Name of </em><em> Pin Layer </em> - copy. </p></td></tr><tr><td colspan="1" rowspan="1"><p><img alt="Screen Shot 2022-12-07 at 4.09.48 PM.png" src="https://mintcdn.com/domoinc-openapi-sync-dataflows/U7eIF7W20YY38vT9/images/kb/ka05w0000012Aef-00N5w00000Ri7BU-0EM5w000005wEfc.jpg?fit=max&auto=format&n=U7eIF7W20YY38vT9&q=85&s=ecaf73c1bdc0ca49cee9011c199fa552" style={{width: 32.9972, height: 31.9886}} width="62" height="56" data-path="images/kb/ka05w0000012Aef-00N5w00000Ri7BU-0EM5w000005wEfc.jpg" /></p></td><td colspan="1" rowspan="1"><p><b> List — </b> Shows the list of individual locations that are currently being displayed. </p></td></tr></tbody></table>

### Creating a Pin Layer

1. Select
   <InlineImage src="/images/kb/ka05w0000012Aef-00N5w00000Ri7BU-0EM5w000005wEfN.jpg" /> **Item** to create a new Pin Layer.

   The **New Pin Layers** **Search** interface displays.

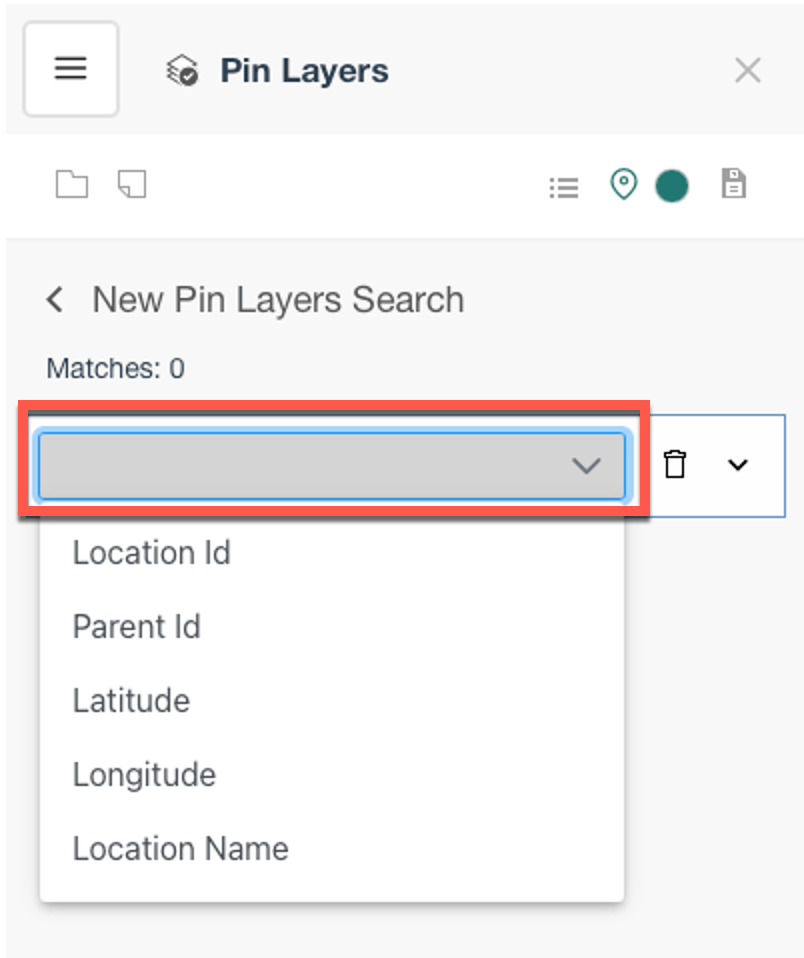
2. Select the list and choose a column from your data to begin filtering down the connected locations data to a subset of the data you want to display on the map. If your data is not connected, complete the necessary configuration by following the steps in the
   [Flex Map v2 Implementation Guide](http://domo-support.domo.com/s/article/000005073?language=en_US).

   <Frame>
     <img alt="new pin layers search.png" src="https://mintcdn.com/domoinc-openapi-sync-dataflows/WU9_nv8qBSXeO2YZ/images/kb/ka05w0000012A9e-00N5w00000Ri7BU-0EM5w000006wG3x.jpg?fit=max&auto=format&n=WU9_nv8qBSXeO2YZ&q=85&s=d6aad873c4813655d17f6888a591aede" style={{width: 276, height: 329}} width="804" height="958" data-path="images/kb/ka05w0000012A9e-00N5w00000Ri7BU-0EM5w000006wG3x.jpg" />
   </Frame>

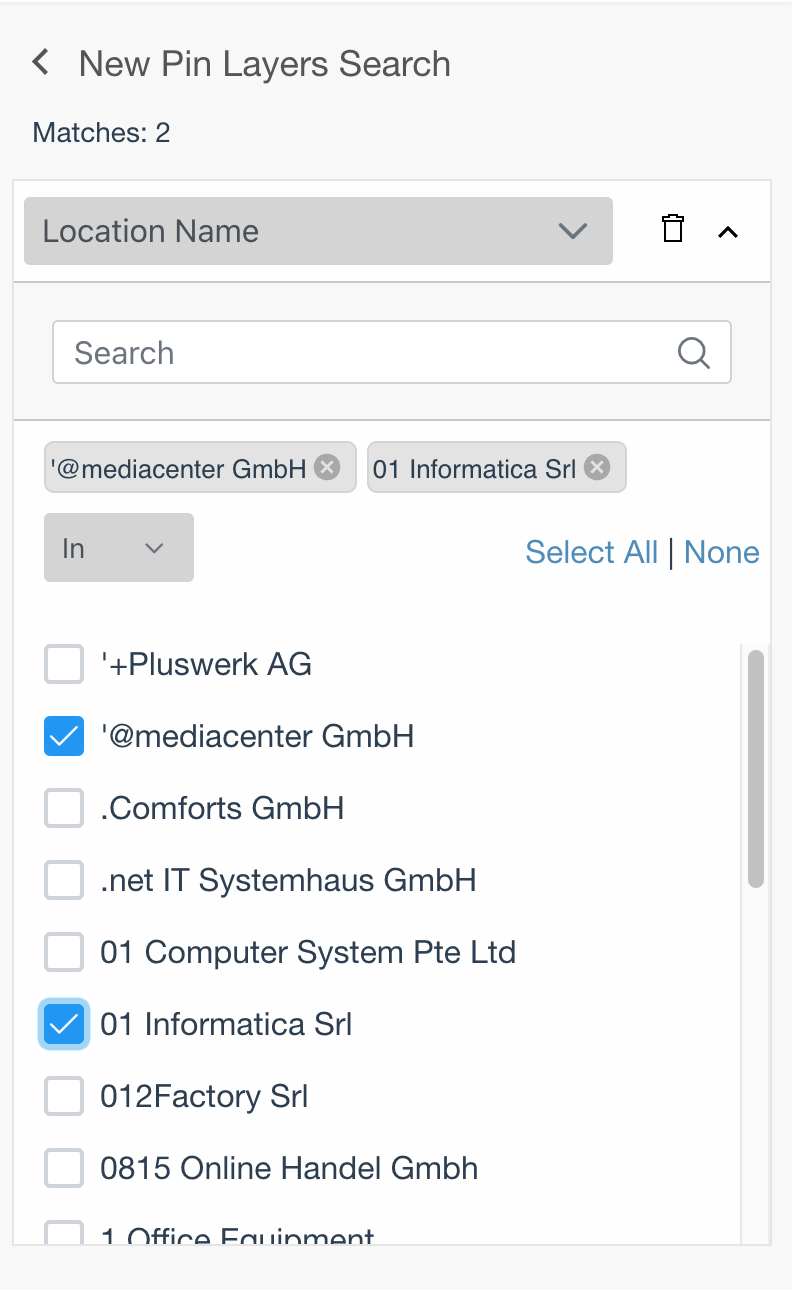
3. Below the selected column, select whether to include locations that are
   **In** or **Not In** the values you select from the column.
   <Frame>
     <img alt="Screen Shot 2022-12-08 at 3.15.48 PM.png" src="https://mintcdn.com/domoinc-openapi-sync-dataflows/WU9_nv8qBSXeO2YZ/images/kb/ka05w0000012A9e-00N5w00000Ri7BU-0EM5w000006wG42.jpg?fit=max&auto=format&n=WU9_nv8qBSXeO2YZ&q=85&s=4cd0438ba242b43f06c7dc0cb9ad9339" style={{width: 278, height: 454}} width="792" height="1290" data-path="images/kb/ka05w0000012A9e-00N5w00000Ri7BU-0EM5w000006wG42.jpg" />
   </Frame>

4. (Optional) To apply more filtering criteria, select
   **Item** again to add another Pin Layer to the current layers.

   * First, select whether the Pin Layer has an
     **And** or an **Or** filter.

     An *And* filter combines current Pin Layers with previous Pin Layers so that only locations that meet all *And* criteria display.

     Using an *Or* filter adds all locations that match that filter along with any other filters that are set.
   * Next, choose the category of additional Layer:
     **Parent Id**, **Latitude**, **Longitude**, **Location Name**, or **City**.

   Two more options, **Channel Type** and **Channel Group**, only display if more than one Pin Layer is pinned.

   You can <InlineImage src="/images/kb/ka05w0000012Aef-00N5w00000Ri7BU-0EM5w000005wEhO.jpg" /> **Delete** any Pin Layer to remove that filter.
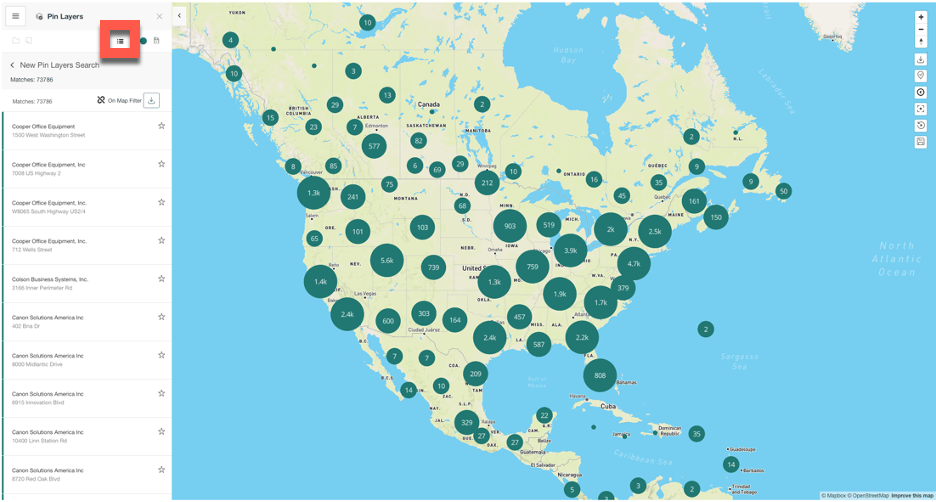
5. Select
   **List** to view the results based on the search criteria.

   <Frame>
     <img alt="list and favorite.png" src="https://mintcdn.com/domoinc-openapi-sync-dataflows/WU9_nv8qBSXeO2YZ/images/kb/ka05w0000012A9e-00N5w00000Ri7BU-0EM5w000006wG4C.jpg?fit=max&auto=format&n=WU9_nv8qBSXeO2YZ&q=85&s=709ac8d7055725f629630b92cadcf885" style={{width: 725, height: 389}} width="936" height="502" data-path="images/kb/ka05w0000012A9e-00N5w00000Ri7BU-0EM5w000006wG4C.jpg" />
   </Frame>

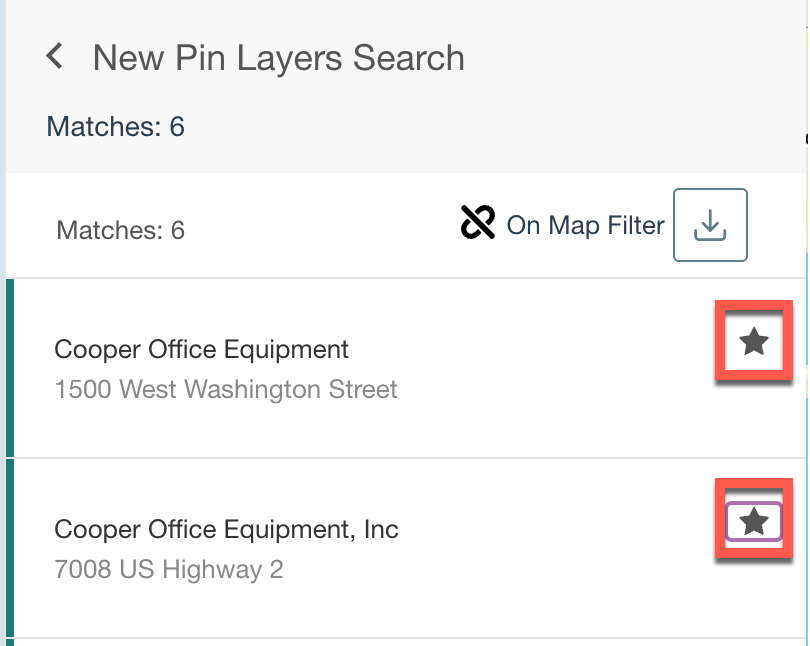
6. (Optional) Select the star icon next to any result to add it to the
   **Favorites** section of the app.
   <Frame>
     <img alt="favorite list items.png" src="https://mintcdn.com/domoinc-openapi-sync-dataflows/WU9_nv8qBSXeO2YZ/images/kb/ka05w0000012A9e-00N5w00000Ri7BU-0EM5w000006wG4H.jpg?fit=max&auto=format&n=WU9_nv8qBSXeO2YZ&q=85&s=833dd5f5dd2a0427b1add8dc83ab599c" style={{width: 307, height: 245}} width="810" height="646" data-path="images/kb/ka05w0000012A9e-00N5w00000Ri7BU-0EM5w000006wG4H.jpg" />
   </Frame>

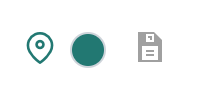
7. After adding all of your filters, note the three buttons added to the
   **Pin Layers** menu: **Select Icon**, **Select Color**, and **Save**.
   <Frame>
     <img alt="Screen Shot 2022-12-08 at 3.37.46 PM.png" src="https://mintcdn.com/domoinc-openapi-sync-dataflows/WU9_nv8qBSXeO2YZ/images/kb/ka05w0000012A9e-00N5w00000Ri7BU-0EM5w000006wG4M.jpg?fit=max&auto=format&n=WU9_nv8qBSXeO2YZ&q=85&s=d2a8d19a6bc584f3a7267bc6376fbadd" width="200" height="98" data-path="images/kb/ka05w0000012A9e-00N5w00000Ri7BU-0EM5w000006wG4M.jpg" />
   </Frame>

#### Adding Icons and Colors

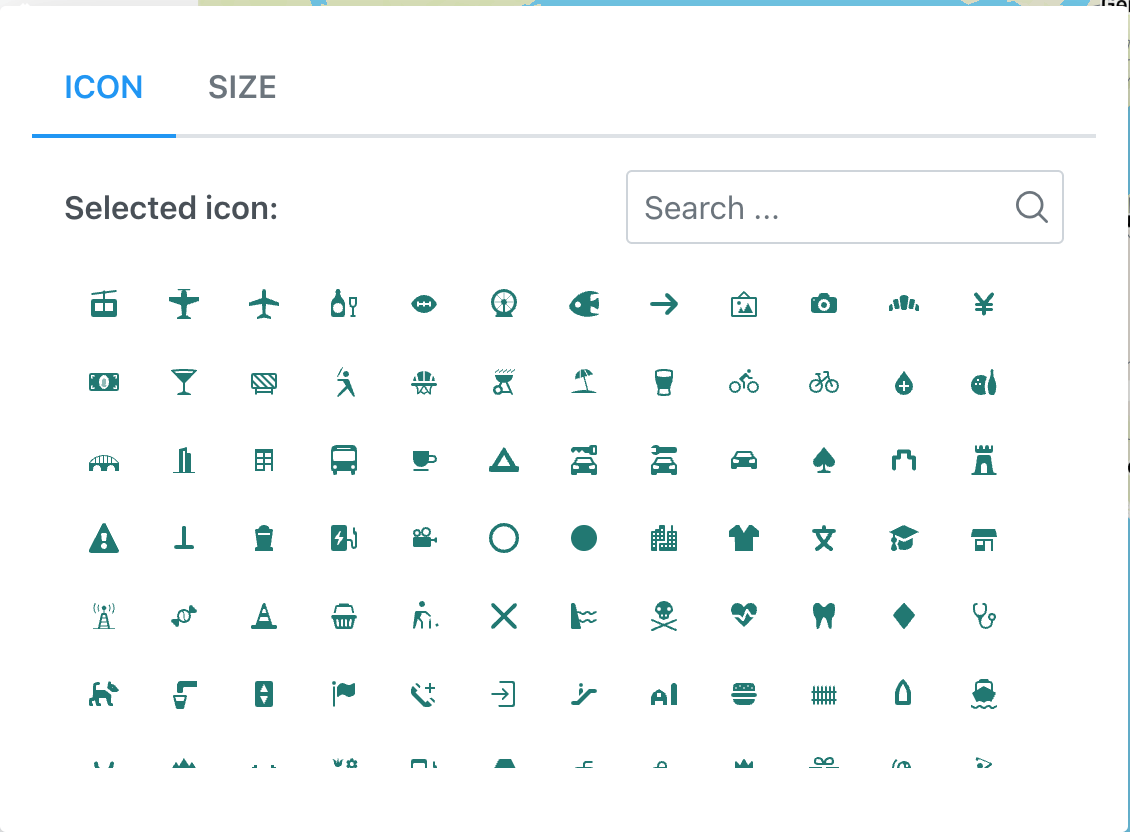
You can choose to display specific locations or landmarks on the map with the icon selection palette. You can only use one icon per Pin Layer. If you want to add another icon, create a new Pin Layer.

1. Choose
   **Select Icon** in the **Pin Layers** menu.

   The icon palette opens.
   <Frame>
     <img alt="Screen Shot 2022-12-07 at 5.13.44 PM.png" src="https://mintcdn.com/domoinc-openapi-sync-dataflows/WU9_nv8qBSXeO2YZ/images/kb/ka05w0000012A9e-00N5w00000Ri7BU-0EM5w000006wG4R.jpg?fit=max&auto=format&n=WU9_nv8qBSXeO2YZ&q=85&s=72f02e19db5edc493539d1a5b5973f5a" style={{width: 452, height: 333}} width="1130" height="832" data-path="images/kb/ka05w0000012A9e-00N5w00000Ri7BU-0EM5w000006wG4R.jpg" />
   </Frame>

2. Select an icon to add to the Pin Layer.

3. (Optional) Go to the
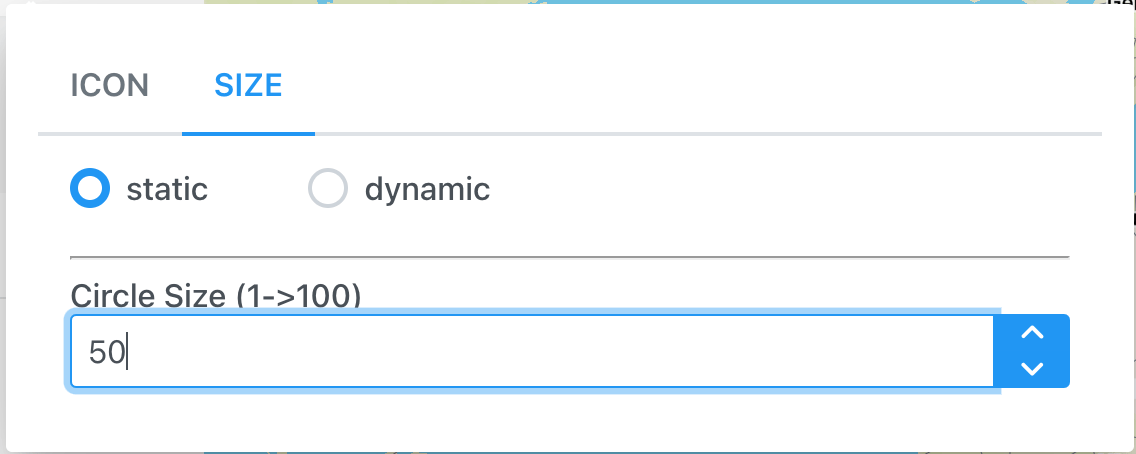
   **Size** tab of the palette to adjust the size of the icon.

   You can also choose to make an icon static or dynamic. If the icon is dynamic, the size changes with the zoom level of the map.

   The icon displays on the map. If it doesn't display, adjust the zoom level.
   <Frame>
     <img alt="Screen Shot 2022-12-07 at 5.14.36 PM.png" src="https://mintcdn.com/domoinc-openapi-sync-dataflows/WU9_nv8qBSXeO2YZ/images/kb/ka05w0000012A9e-00N5w00000Ri7BU-0EM5w000006wG4W.jpg?fit=max&auto=format&n=WU9_nv8qBSXeO2YZ&q=85&s=995d9edecdd8dfb2ea88329fe2e517ea" style={{width: 429, height: 172}} width="1136" height="454" data-path="images/kb/ka05w0000012A9e-00N5w00000Ri7BU-0EM5w000006wG4W.jpg" />
   </Frame>

4. In the
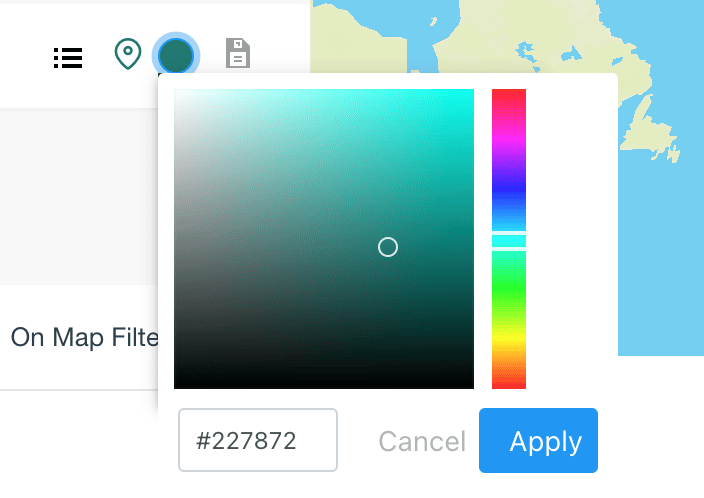
   **Pin Layers** menu, choose **Select Color** to choose the display color for your search.
   <Frame>
     <img alt="Screen Shot 2022-12-07 at 5.23.03 PM.png" src="https://mintcdn.com/domoinc-openapi-sync-dataflows/WU9_nv8qBSXeO2YZ/images/kb/ka05w0000012A9e-00N5w00000Ri7BU-0EM5w000006wG4b.jpg?fit=max&auto=format&n=WU9_nv8qBSXeO2YZ&q=85&s=39cb8ed3fea264cf0bd9a557f9d416a5" style={{width: 331, height: 234}} width="704" height="498" data-path="images/kb/ka05w0000012A9e-00N5w00000Ri7BU-0EM5w000006wG4b.jpg" />
   </Frame>

5. Select
   **Save** in the **Pin Layers** menu to save your search.

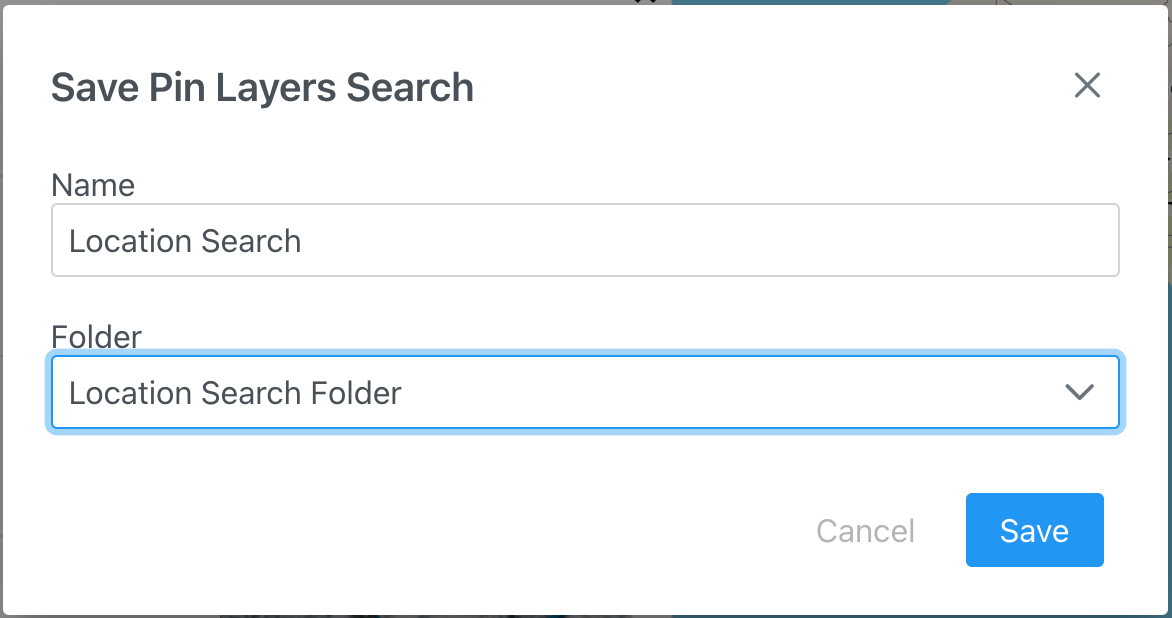
   The **Save Pin Layers Search** modal displays.

6. Enter a
   **Name** and choose a **Folder** or **Group** to save the search in or create one.

7. Select
   **Save**.
   <Frame>
     <img alt="Screen Shot 2022-12-07 at 5.21.44 PM.png" src="https://mintcdn.com/domoinc-openapi-sync-dataflows/WU9_nv8qBSXeO2YZ/images/kb/ka05w0000012A9e-00N5w00000Ri7BU-0EM5w000006wG4g.jpg?fit=max&auto=format&n=WU9_nv8qBSXeO2YZ&q=85&s=2f9fc242e10a068bb9e39b303790decb" style={{width: 425, height: 224}} width="1172" height="618" data-path="images/kb/ka05w0000012A9e-00N5w00000Ri7BU-0EM5w000006wG4g.jpg" />
   </Frame>

You can now access your search in a list of created searches and groups under the <InlineImage src="/images/kb/ka05w0000012Aef-00N5w00000Ri7BU-0EM5w000005wEfD.jpg" /> **Group** icon in the **Pin Layers** menu. You can also access all saved items from the **Saved Maps** section of the main menu.
### Groups and Items

In Flex Map v2, groups are folders that hold and organize items you create.

When you select <InlineImage src="/images/kb/ka05w0000012Aef-00N5w00000Ri7BU-0EM5w000005wEfD.jpg" /> **Group** in the **Pin Layers** menu, you create a folder that displays in the groups list. You can then name and open the group and drag any items into the group. You can also nest folders by dragging a group into another group.

After you save an Item or search inside a folder or group, you can interact with it.

Select <InlineImage src="/images/kb/ka05w0000012Aef-00N5w00000Ri7BU-0EM5w000005wEpr.jpg" /> **View** / **Hide** on a search to toggle it on or off. When a search is on, the locations of the search display on the map. Remove an item or group by selecting <InlineImage src="/images/kb/ka05w0000012Aef-00N5w00000Ri7BU-0EM5w000005wEhO.jpg" /> **Delete**.

<Warning>
  **Important:** If you delete a group, all items inside the group, including nested items, are also deleted.
</Warning>

You can edit an Item or search at any time in **Pin Layers**.

<Note>
  **Note:** App admins see an additional option for items and groups: the **Share** button. Admins can share items and groups with other app users. Learn more about admin functionality under [User Permissions and Features](#user_permissions).
</Note>

## Map Layers

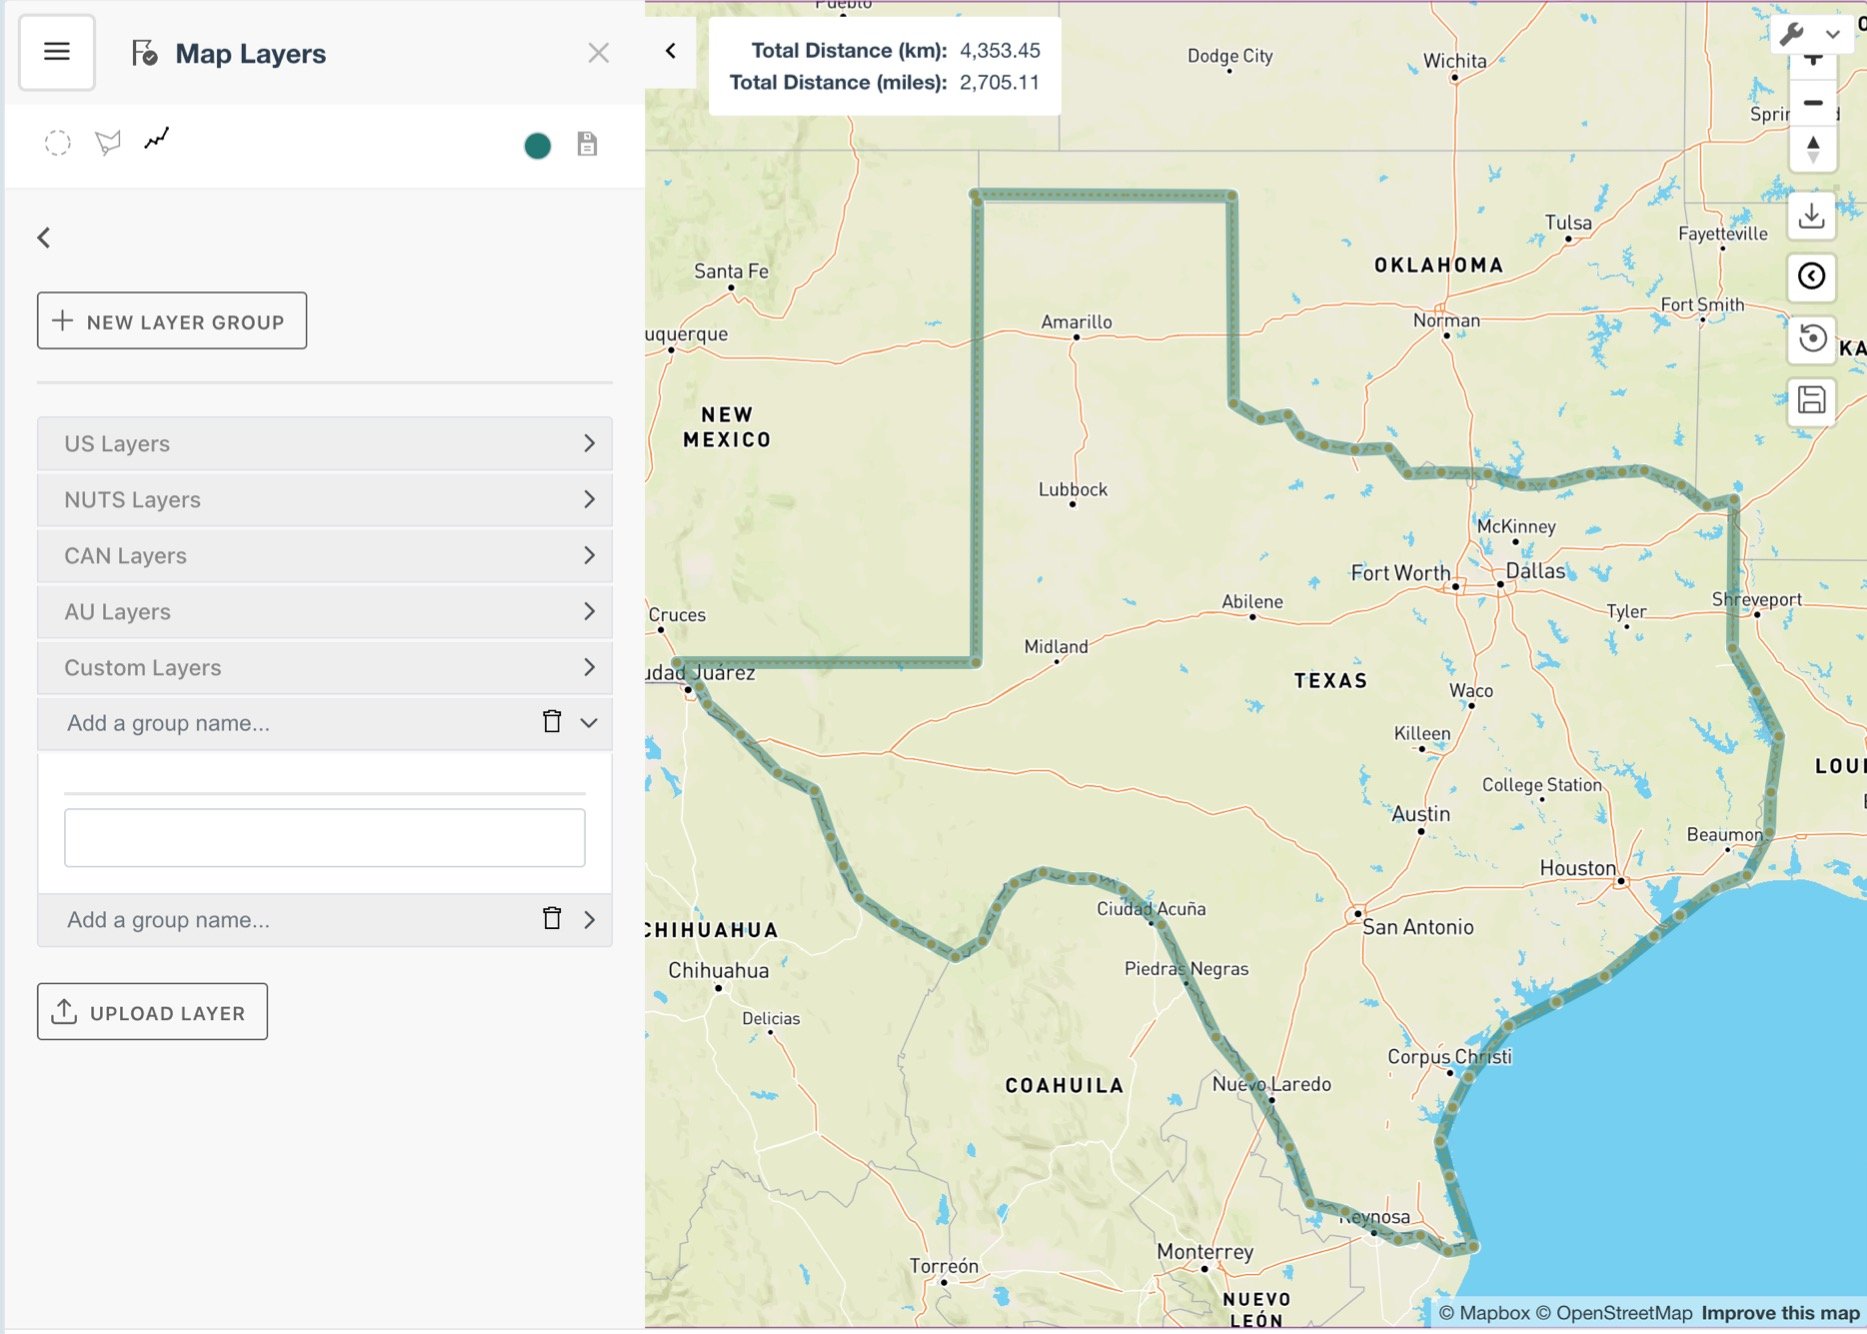
Map Layers in the Flex Map v2 app are data driven from values stored in KML or GeoJSON, so interaction with them is more limited than other items in the app. The purpose of Map Layers is to display constantly updated lines or shapes on the map with their associated metrics, which are read directly from the uploaded layer file. For example, you may want to display shipping routes and their attributes from an outside system.

To begin, the data for layers must be correctly prepared. Learn how to do that in the [Flex Map v2 Implementation Guide](http://domo-support.domo.com/s/article/000005073?language=en_US).

### Creating a Map Layer

1. In the main menu, select
   **Map Layers**.
2. Select
   <InlineImage src="/images/kb/ka05w0000012Aef-00N5w00000Ri7BU-0EM5w000005wEfN.jpg" /> **Item**.

   The new Layers interface displays.
3. In the
   **Map Layers** menu, there are three icons on the left side: <InlineImage src="/images/kb/ka05w0000012Aef-00N5w00000Ri7BU-0EM5w000005wEqa.jpg" /> **Circle**, <InlineImage src="/images/kb/ka05w0000012Aef-00N5w00000Ri7BU-0EM5w000005wEqf.jpg" /> **Polygon**, and <InlineImage src="/images/kb/ka05w0000012Aef-00N5w00000Ri7BU-0EM5w000005wEqk.jpg" /> **Polyline**.

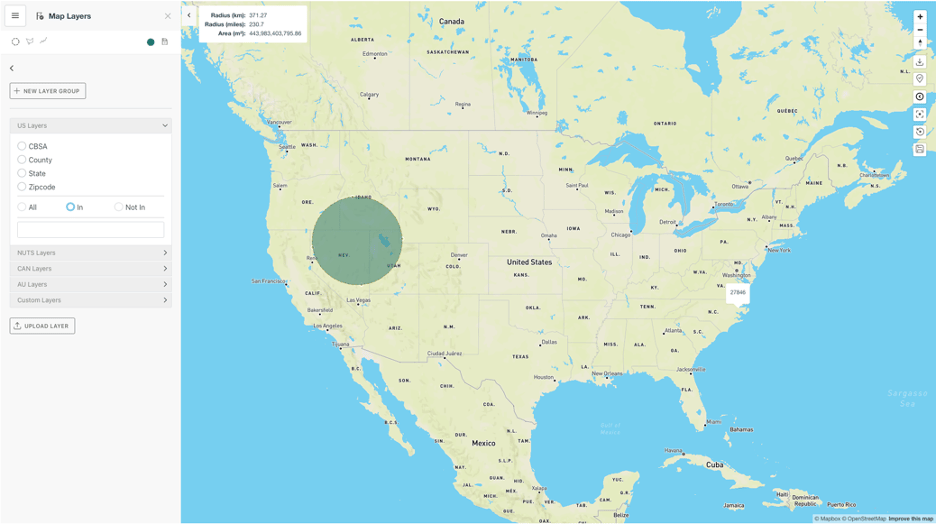
   When you select <InlineImage src="/images/kb/ka05w0000012Aef-00N5w00000Ri7BU-0EM5w000005wEqa.jpg" /> **Circle**, you can create a colored circle on the map with the area and radius provided. Adjust the size of the circle by clicking and dragging the orange dots on the perimeter of the circle. You can also click and drag the entire shape. Change the color of the circle by using the **Select Color** icon. If you want to start over, select <InlineImage src="/images/kb/ka05w0000012Aef-00N5w00000Ri7BU-0EM5w000005wEqa.jpg" /> **Circle** again to delete it.

   <Frame>
     <img alt="circle.png" src="https://mintcdn.com/domoinc-openapi-sync-dataflows/WU9_nv8qBSXeO2YZ/images/kb/ka05w0000012A9e-00N5w00000Ri7BU-0EM5w000006wG5P.jpg?fit=max&auto=format&n=WU9_nv8qBSXeO2YZ&q=85&s=3a40f858b93fe092230feffb89abac55" style={{width: 598, height: 335}} width="936" height="524" data-path="images/kb/ka05w0000012A9e-00N5w00000Ri7BU-0EM5w000006wG5P.jpg" />
   </Frame>

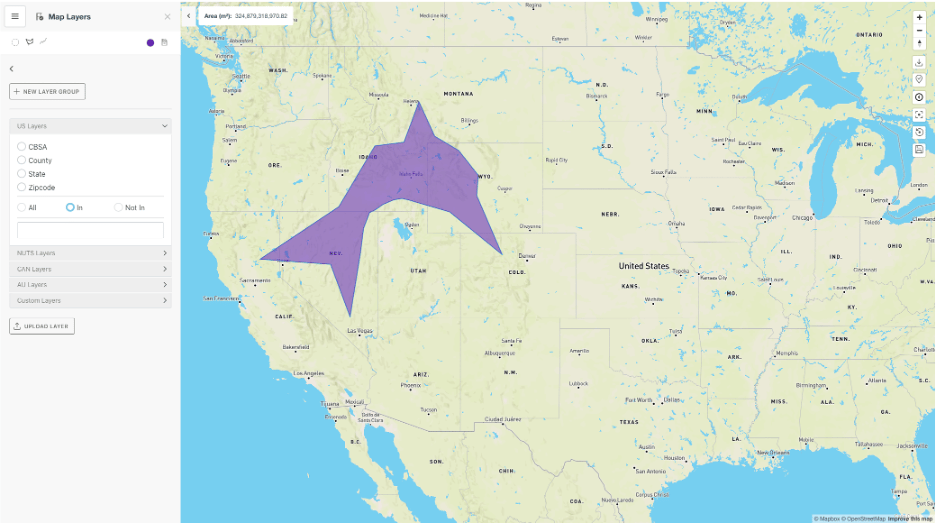
   The second of the three icons is <InlineImage src="/images/kb/ka05w0000012Aef-00N5w00000Ri7BU-0EM5w000005wEqf.jpg" /> **Polygon** and allows you to create a shape with numerous sides. To use the tool, select <InlineImage src="/images/kb/ka05w0000012Aef-00N5w00000Ri7BU-0EM5w000005wEqf.jpg" /> **Polygon** and choose a point on the map where you want the shape to begin. Keep adding points to the map until you achieve the shape you want. To finish the shape, select the last orange dot that you placed. You can move the entire shape by clicking inside it and dragging. To adjust the shape, click and drag the orange dots. To change the color, use the **Select Color** icon. To delete the shape, select <InlineImage src="/images/kb/ka05w0000012Aef-00N5w00000Ri7BU-0EM5w000005wEqf.jpg" /> **Polygon** again

   <Frame>
     <img src="https://mintcdn.com/domoinc-openapi-sync-dataflows/WU9_nv8qBSXeO2YZ/images/kb/ka05w0000012A9e-00N5w00000Ri7BU-0EM5w000006wG5e.jpg?fit=max&auto=format&n=WU9_nv8qBSXeO2YZ&q=85&s=f6de0d18833d45684c51b67ccdadc24f" width="936" height="524" data-path="images/kb/ka05w0000012A9e-00N5w00000Ri7BU-0EM5w000006wG5e.jpg" />
   </Frame>

   The last icon is <InlineImage src="/images/kb/ka05w0000012Aef-00N5w00000Ri7BU-0EM5w000005wEqk.jpg" /> **Polyline**, which allows you to determine the total distance traveled along a path. You can create this path by clicking on the map, which leaves a trail of orange dots for every marker you place. When you are done, select the last orange marker you placed; the total distance of the polyline displays. To start over, select <InlineImage src="/images/kb/ka05w0000012Aef-00N5w00000Ri7BU-0EM5w000005wEqk.jpg" /> **Polyline** again.

   <Frame>
     <img alt="polyline.jpg" src="https://mintcdn.com/domoinc-openapi-sync-dataflows/WU9_nv8qBSXeO2YZ/images/kb/ka05w0000012A9e-00N5w00000Ri7BU-0EM5w000006wG5t.jpg?fit=max&auto=format&n=WU9_nv8qBSXeO2YZ&q=85&s=f7668d7a1369b96a80f4f93aeccb2c2d" style={{width: 596, height: 426}} width="1867" height="1334" data-path="images/kb/ka05w0000012A9e-00N5w00000Ri7BU-0EM5w000006wG5t.jpg" />
   </Frame>

## Favorites

**Favorites** is where you can find any locations favorited in the app, allowing you to quickly find important locations when you return to the app. You can add locations to **Favorites** in a few ways.

If you enter a term in the main search bar of the app, a list of matching locations returns. You can then select the star icon next to a location to favorite it.

You can also favorite currently displayed locations in the **List** screen of the **Pin Layers** section.

When viewing **Favorites**, you can create Groups and add favorited items to them, like you can for searches and Heatmaps. You can remove locations from **Favorites** by selecting <InlineImage src="/images/kb/ka05w0000012Aef-00N5w00000Ri7BU-0EM5w000005wEhO.jpg" /> **Delete** for the location.
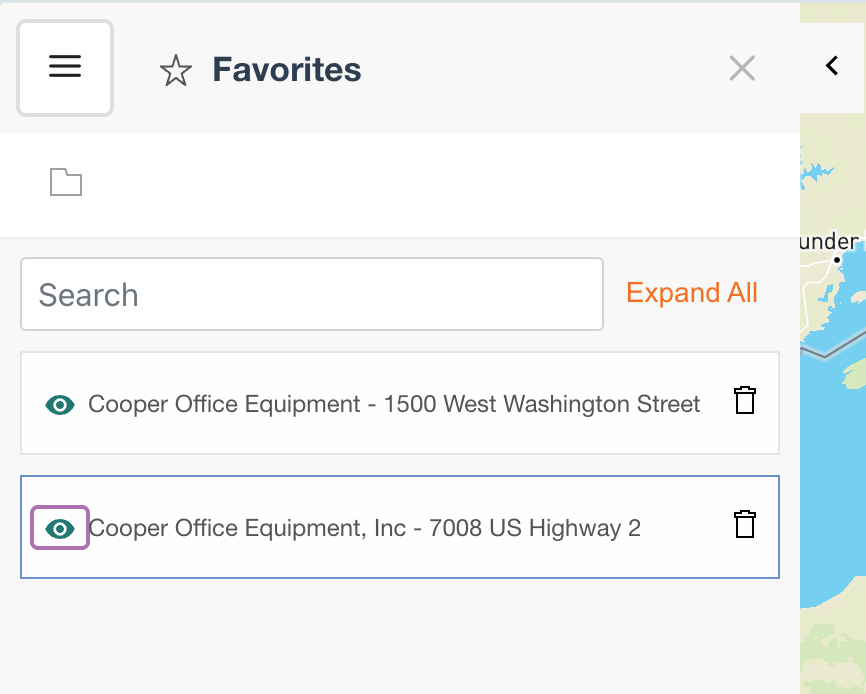
Select <InlineImage src="/images/kb/ka05w0000012Aef-00N5w00000Ri7BU-0EM5w000005wEpr.jpg" /> **View** / **Hide** to toggle a favorited location on and off.

<Frame>
  <img alt="Screen Shot 2022-12-07 at 8.56.30 PM.png" src="https://mintcdn.com/domoinc-openapi-sync-dataflows/WU9_nv8qBSXeO2YZ/images/kb/ka05w0000012A9e-00N5w00000Ri7BU-0EM5w000006wG68.jpg?fit=max&auto=format&n=WU9_nv8qBSXeO2YZ&q=85&s=d5f28322afe0b16385b1bd183f3410e5" style={{width: 331, height: 266}} width="866" height="694" data-path="images/kb/ka05w0000012A9e-00N5w00000Ri7BU-0EM5w000006wG68.jpg" />
</Frame>

Admin users can share favorited locations here by selecting **Share** for the location.

## Saved Maps

Any user can save the current configuration of territories and searches at any time by selecting <InlineImage src="/images/kb/ka05w0000012Aef-00N5w00000Ri7BU-0EM5w000005wCF3.jpg" /> **Save Map** in the map controls. When you save a map, you are prompted to enter a name for it.
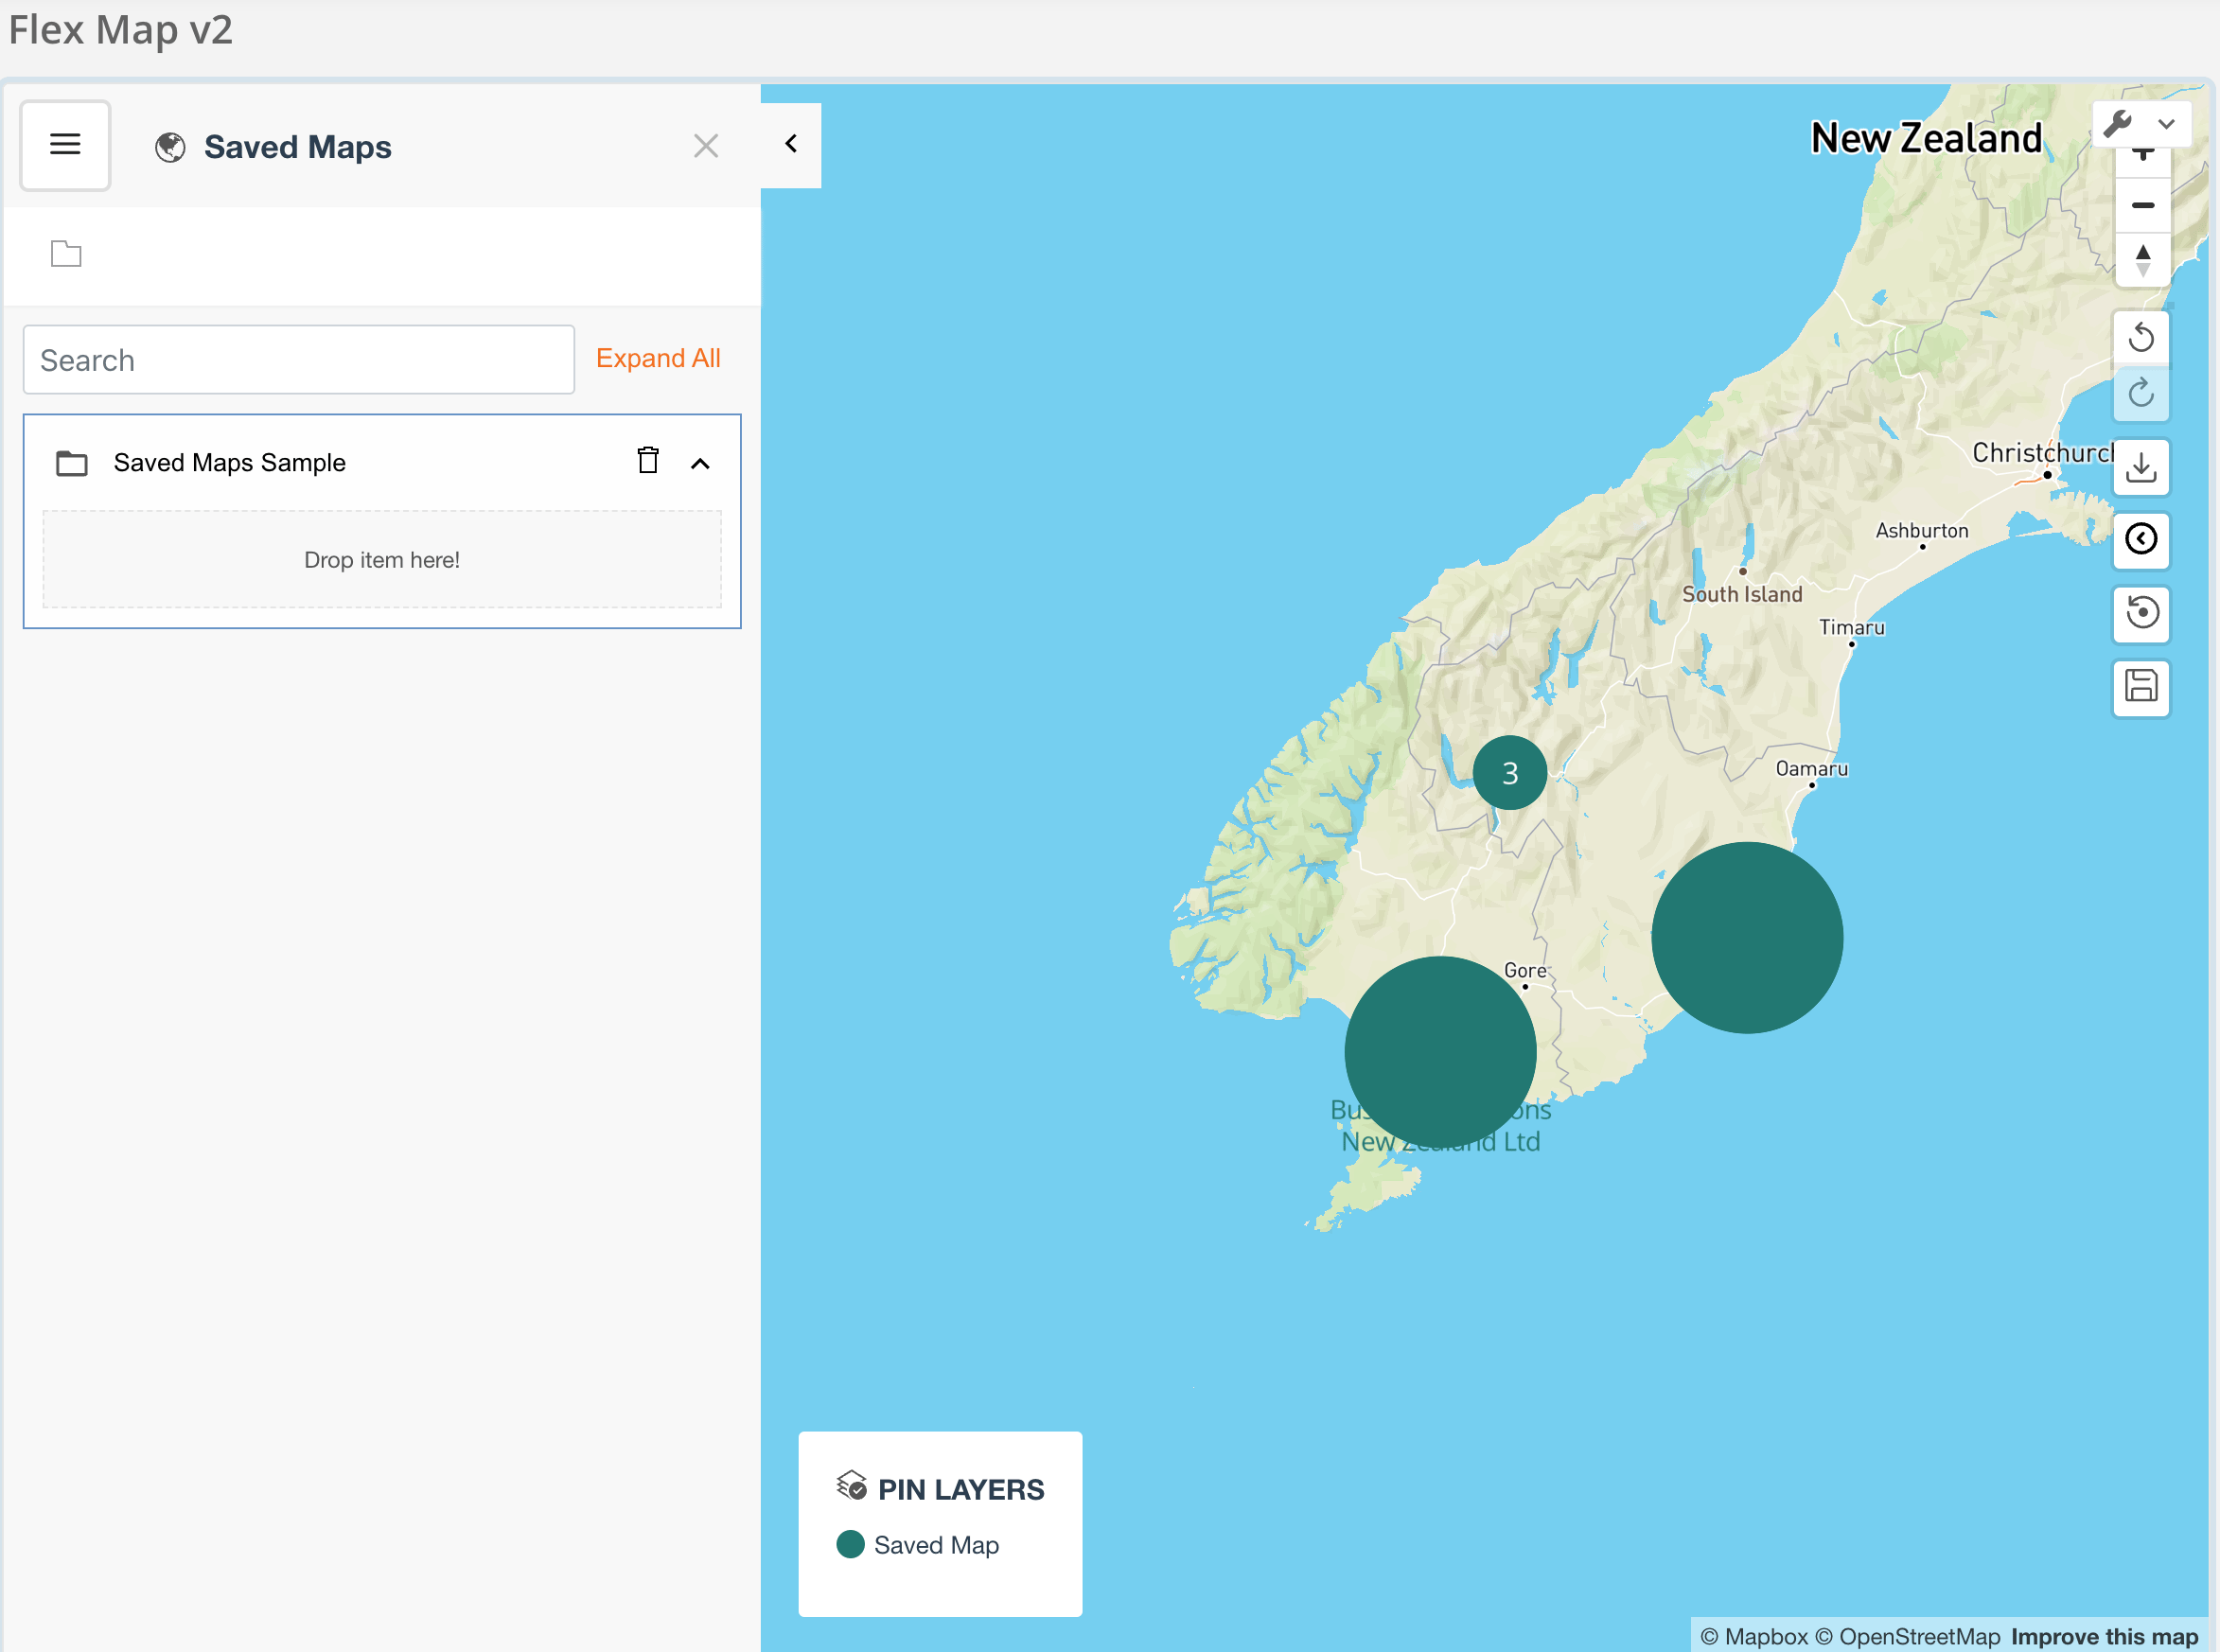
You can see all of the maps by going to **Saved Maps** in the main menu. Here, you can add saved maps to Groups or delete them like other items in the app.

Admin users can also share saved maps by selecting **Share** on a saved map.

<Frame>
  <img alt="Screen Shot 2022-12-07 at 8.09.07 PM.png" src="https://mintcdn.com/domoinc-openapi-sync-dataflows/WU9_nv8qBSXeO2YZ/images/kb/ka05w0000012A9e-00N5w00000Ri7BU-0EM5w000006wFxc.jpg?fit=max&auto=format&n=WU9_nv8qBSXeO2YZ&q=85&s=ece5e981854d6b1a26214cae3ade83e5" style={{width: 584, height: 435}} width="2346" height="1746" data-path="images/kb/ka05w0000012A9e-00N5w00000Ri7BU-0EM5w000006wFxc.jpg" />
</Frame>

## Heatmaps

You can find **Heatmaps** in the main menu. Follow the steps below to create a new Heatmap.
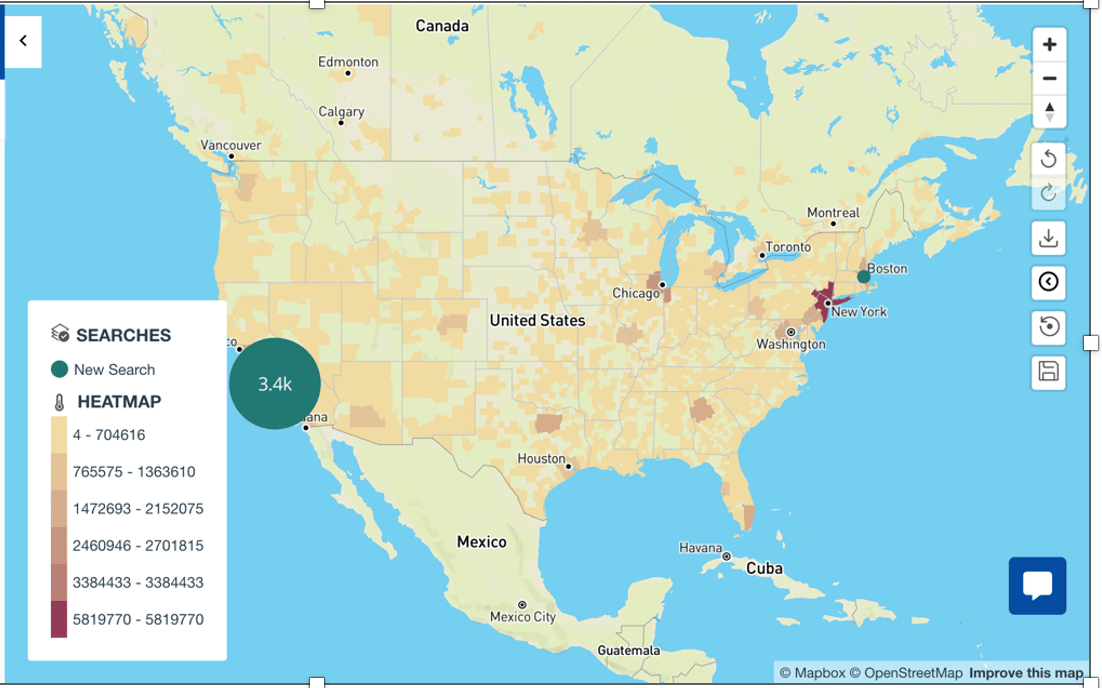
<Note>
  **Note:** Heatmaps only take effect after you save them.
</Note>

1. Select
   **Create a New Heatmap**.
2. Select a
   **Heatmap Layer**.
3. Select a
   **Heatmap Metric**.
4. Under
   **Color Range**, select <InlineImage src="/images/kb/ka05w0000012Aef-00N5w00000Ri7BU-0EM5w000005wFvv.jpg" /> **Edit Range**.
   * Select the colored rectangle to choose and apply a color to a certain range.

     Manually input the numerals for the range.

     Remove any range by selecting **Delete**.
   * Above the ranges, you can
     <InlineImage src="/images/kb/ka05w0000012Aef-00N5w00000Ri7BU-0EM5w000005wFw0.jpg" /> **Reset to default**, <InlineImage src="/images/kb/ka05w0000012Aef-00N5w00000Ri7BU-0EM5w000005wFwA.jpg" /> **Clear all**, and <InlineImage src="/images/kb/ka05w0000012Aef-00N5w00000Ri7BU-0EM5w000005wFwF.jpg" /> **Add new**.
   * Make sure to select
     **Apply Range** to save your changes.
5. To activate the Heatmap, select
   **Save**.

You can then name your Heatmap and save it to a new or existing folder or Group.

Select <InlineImage src="/images/kb/ka05w0000012Aef-00N5w00000Ri7BU-0EM5w000005wEpr.jpg" /> **View** / **Hide** to display the new Heatmap on the map.

Depending on the column you choose for the Heatmap, the map legend displays different numerical ranges.

<Note>
  **Note:** Only one Heatmap can display at a time, unlike searches where many can display at one time.
</Note>

<Frame>
  <img src="https://mintcdn.com/domoinc-openapi-sync-dataflows/WU9_nv8qBSXeO2YZ/images/kb/ka05w0000012A9e-00N5w00000Ri7BU-0EM5w000006wG6c.jpg?fit=max&auto=format&n=WU9_nv8qBSXeO2YZ&q=85&s=47a5e152c06bdcfe800611ac12bc58ac" width="1102" height="688" data-path="images/kb/ka05w0000012A9e-00N5w00000Ri7BU-0EM5w000006wG6c.jpg" />
</Frame>

## Map Settings

**Map Settings** is the final option in the main menu.

If you are a card owner or app admin, you can determine certain map behaviors rendering options, including rendering Pin Layers in standard cluster mode or allowing all pins to render individually on the map. You also have access to new Map Layers in the **Base Layer** menu.
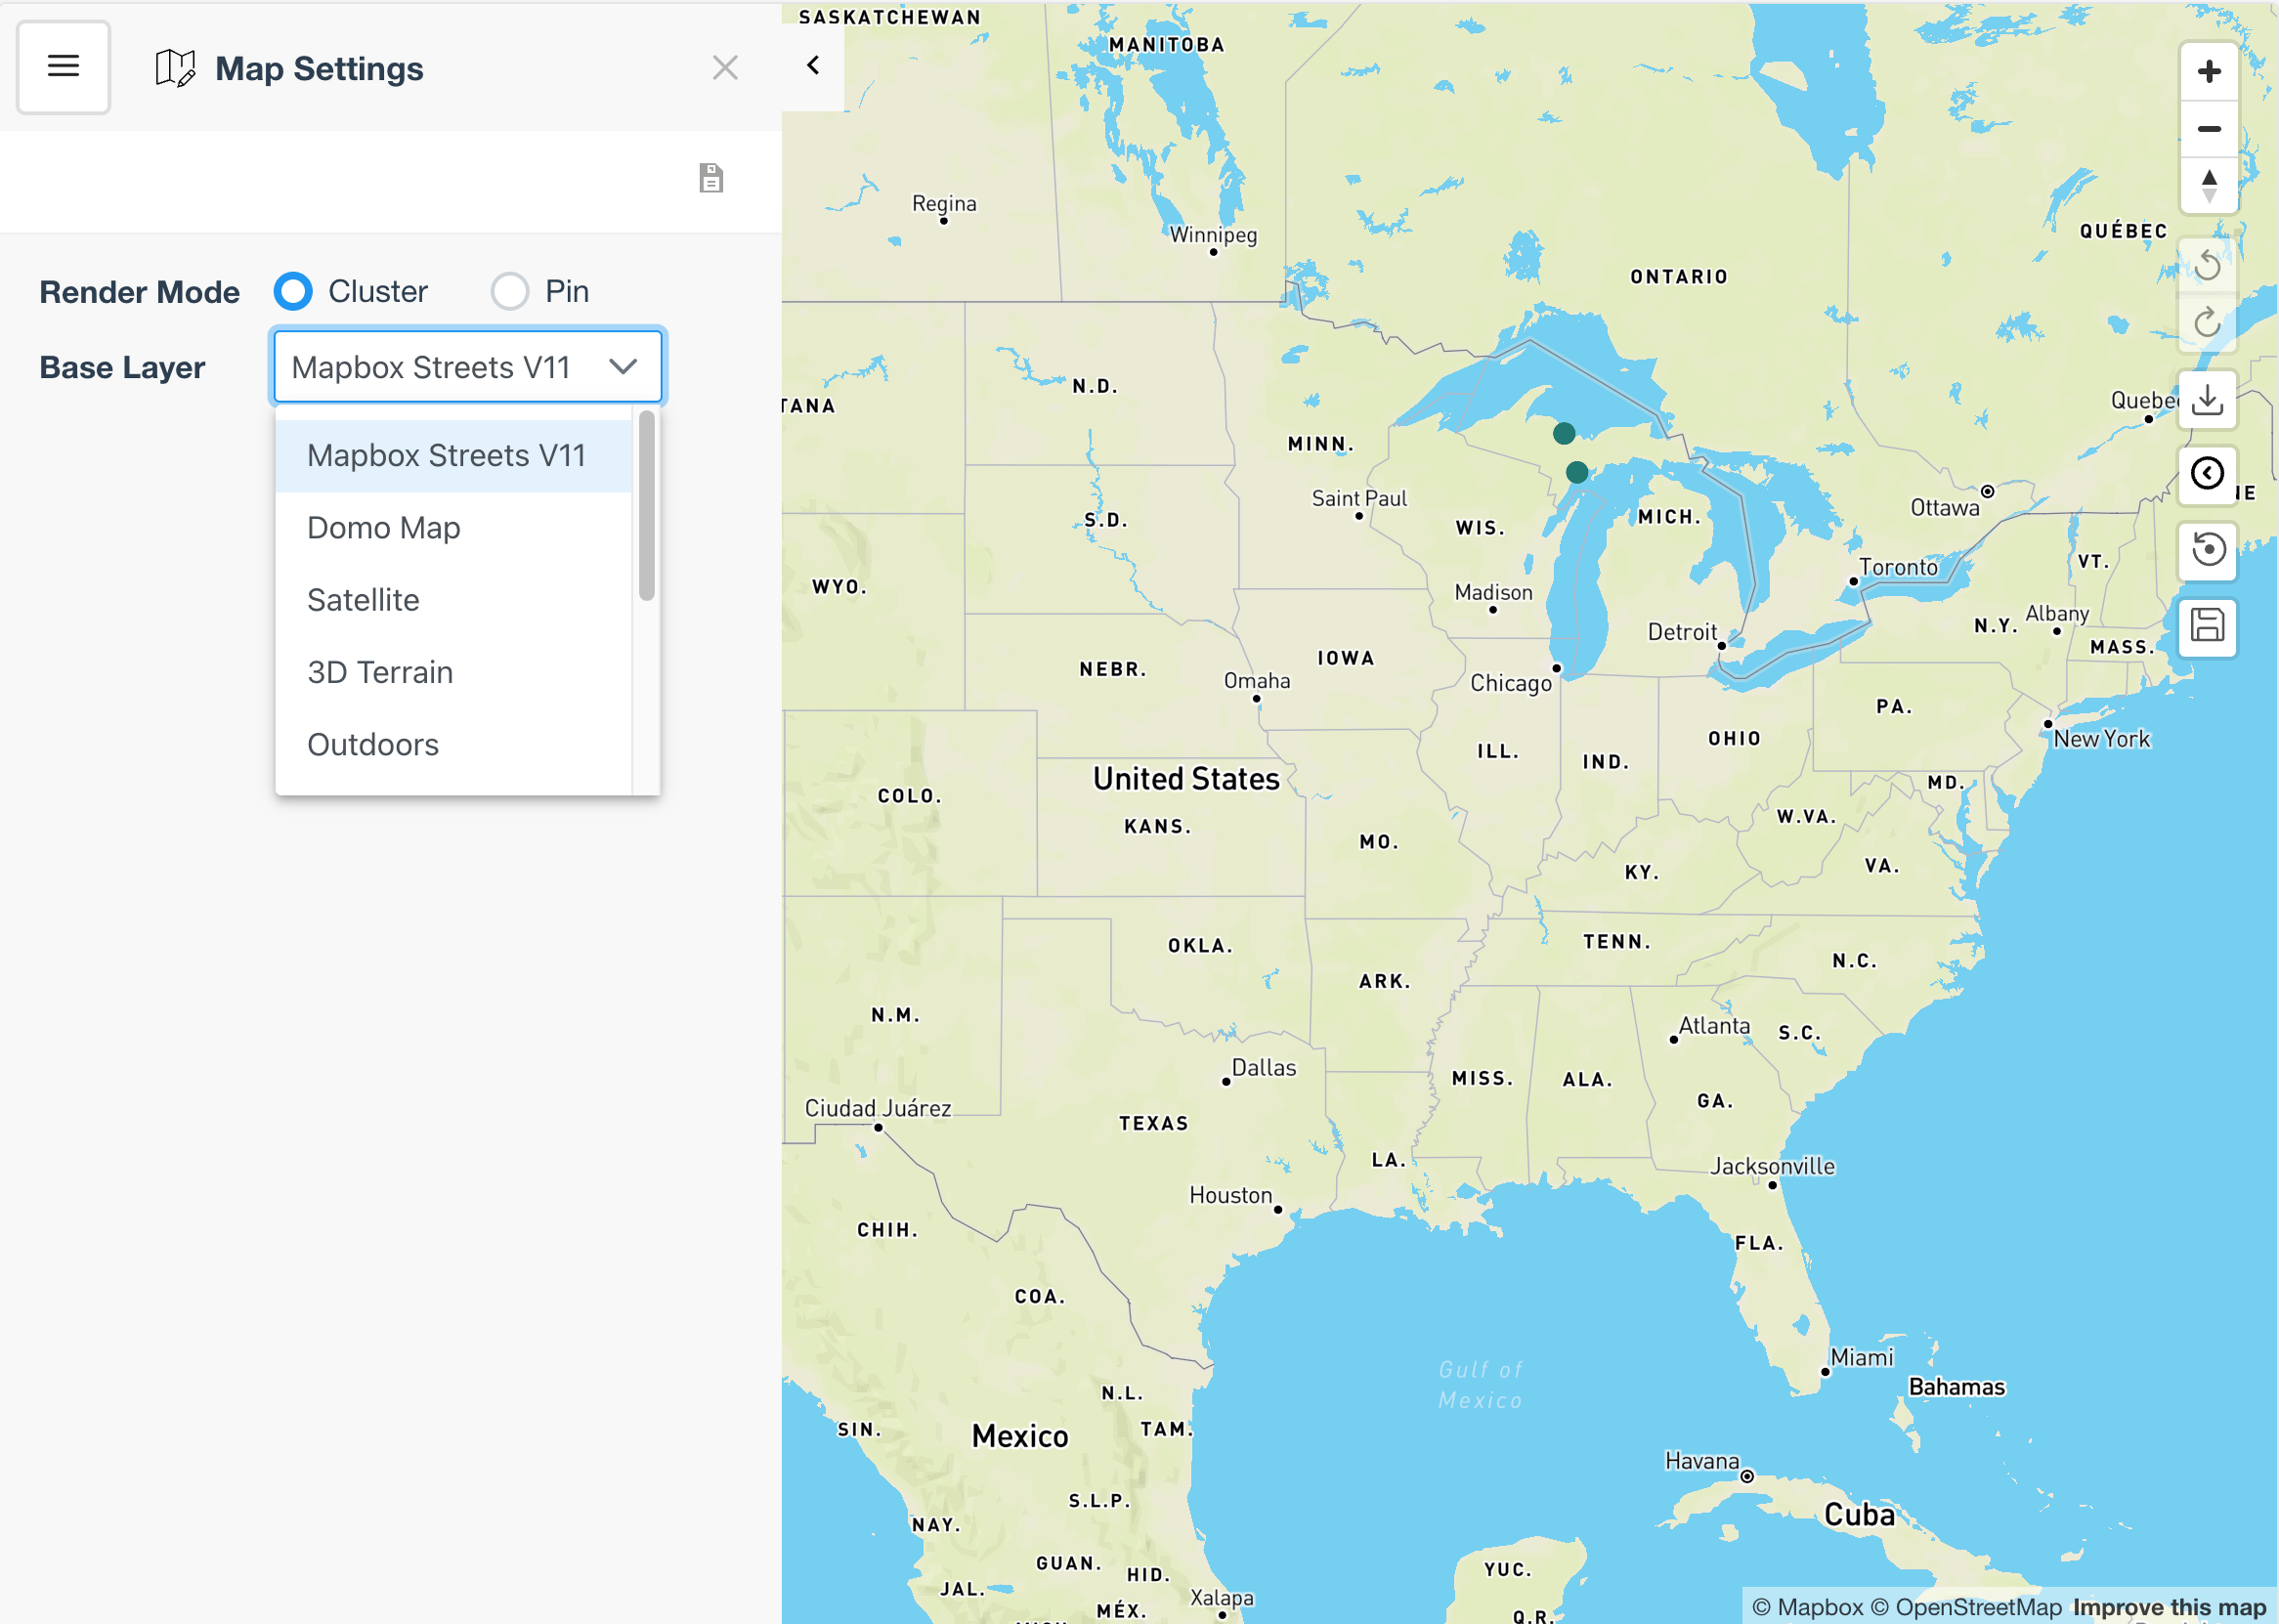
<Frame>
  <img alt="Screen Shot 2022-12-07 at 7.22.34 PM.png" src="https://mintcdn.com/domoinc-openapi-sync-dataflows/WU9_nv8qBSXeO2YZ/images/kb/ka05w0000012A9e-00N5w00000Ri7BU-0EM5w000006wG6h.jpg?fit=max&auto=format&n=WU9_nv8qBSXeO2YZ&q=85&s=93053a71d7f3f38cab0e19c5035f867c" style={{width: 635, height: 450.99}} width="2332" height="1662" data-path="images/kb/ka05w0000012A9e-00N5w00000Ri7BU-0EM5w000006wG6h.jpg" />
</Frame>

## Data Settings

<Note>
  **Note:** This section is only visible on the main menu for card owners and app admins.
</Note>

If you are a card owner or app admin, you have total control over the data that is available to the map for locations and Heatmap metrics.

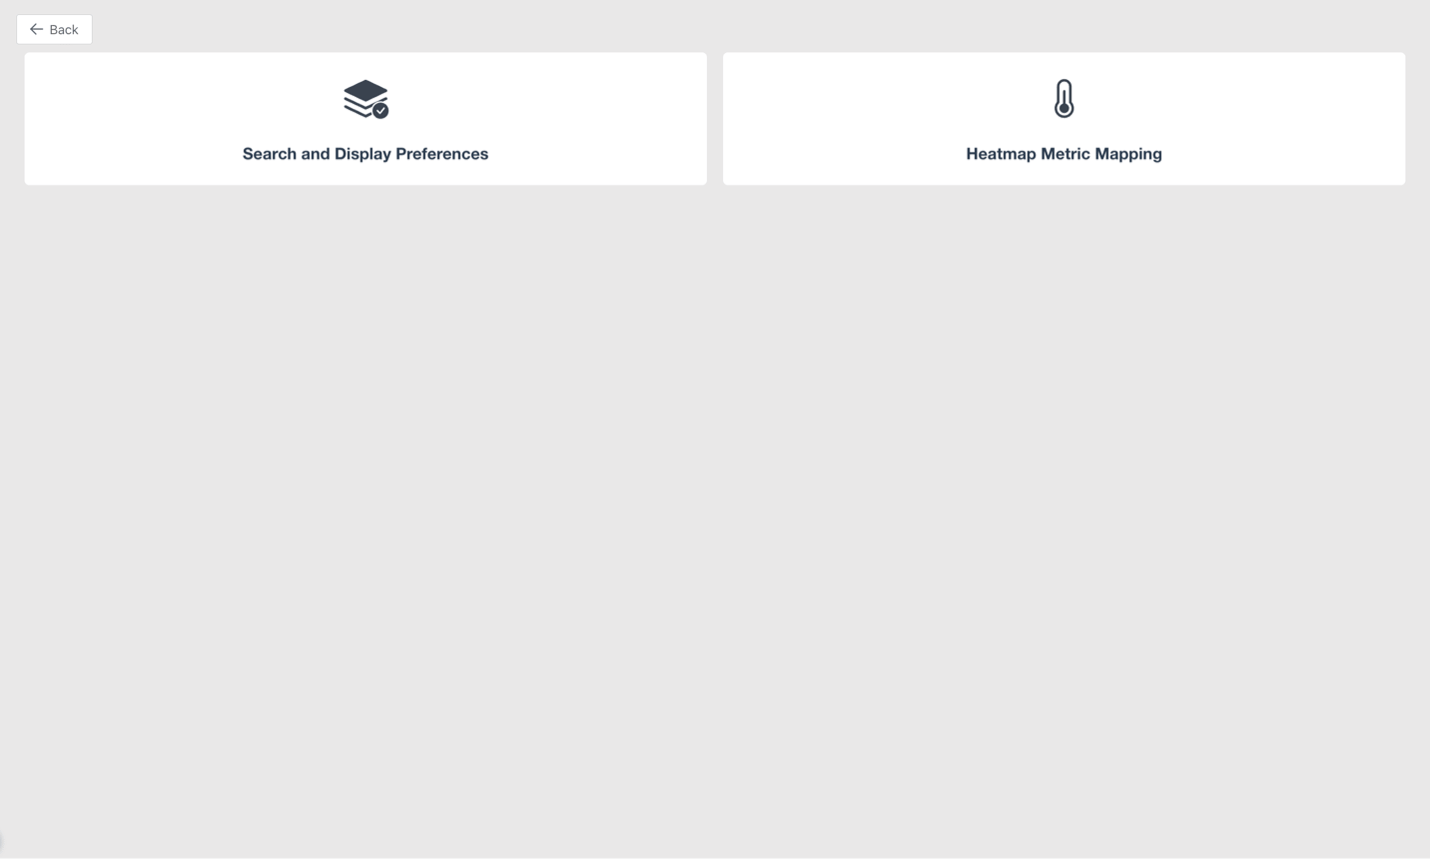
From the main menu, select **Data Settings** to view two options:

* The
  **Search and Display Preferences** allow you to customize what is shown on your map.
* **Heatmap Metric Mapping**
  allows you to define metrics for your Heatmap Layers and associate them with a color scale on the map.

<Frame>
  <img alt="data settings.png" src="https://mintcdn.com/domoinc-openapi-sync-dataflows/U7eIF7W20YY38vT9/images/kb/ka05w0000012Aef-00N5w00000Ri7BU-0EM5w000005wHEo.jpg?fit=max&auto=format&n=U7eIF7W20YY38vT9&q=85&s=0fc189a09aec47ee6e6dc223bdc5cc4c" style={{width: 644, height: 388}} width="1430" height="864" data-path="images/kb/ka05w0000012Aef-00N5w00000Ri7BU-0EM5w000005wHEo.jpg" />
</Frame>

### Search and Display Preferences

When you select **Search and Display Preferences**, the settings grid displays. There are three sections in the settings: **Schema**, **Display Order**, and **Tooltip Order**.
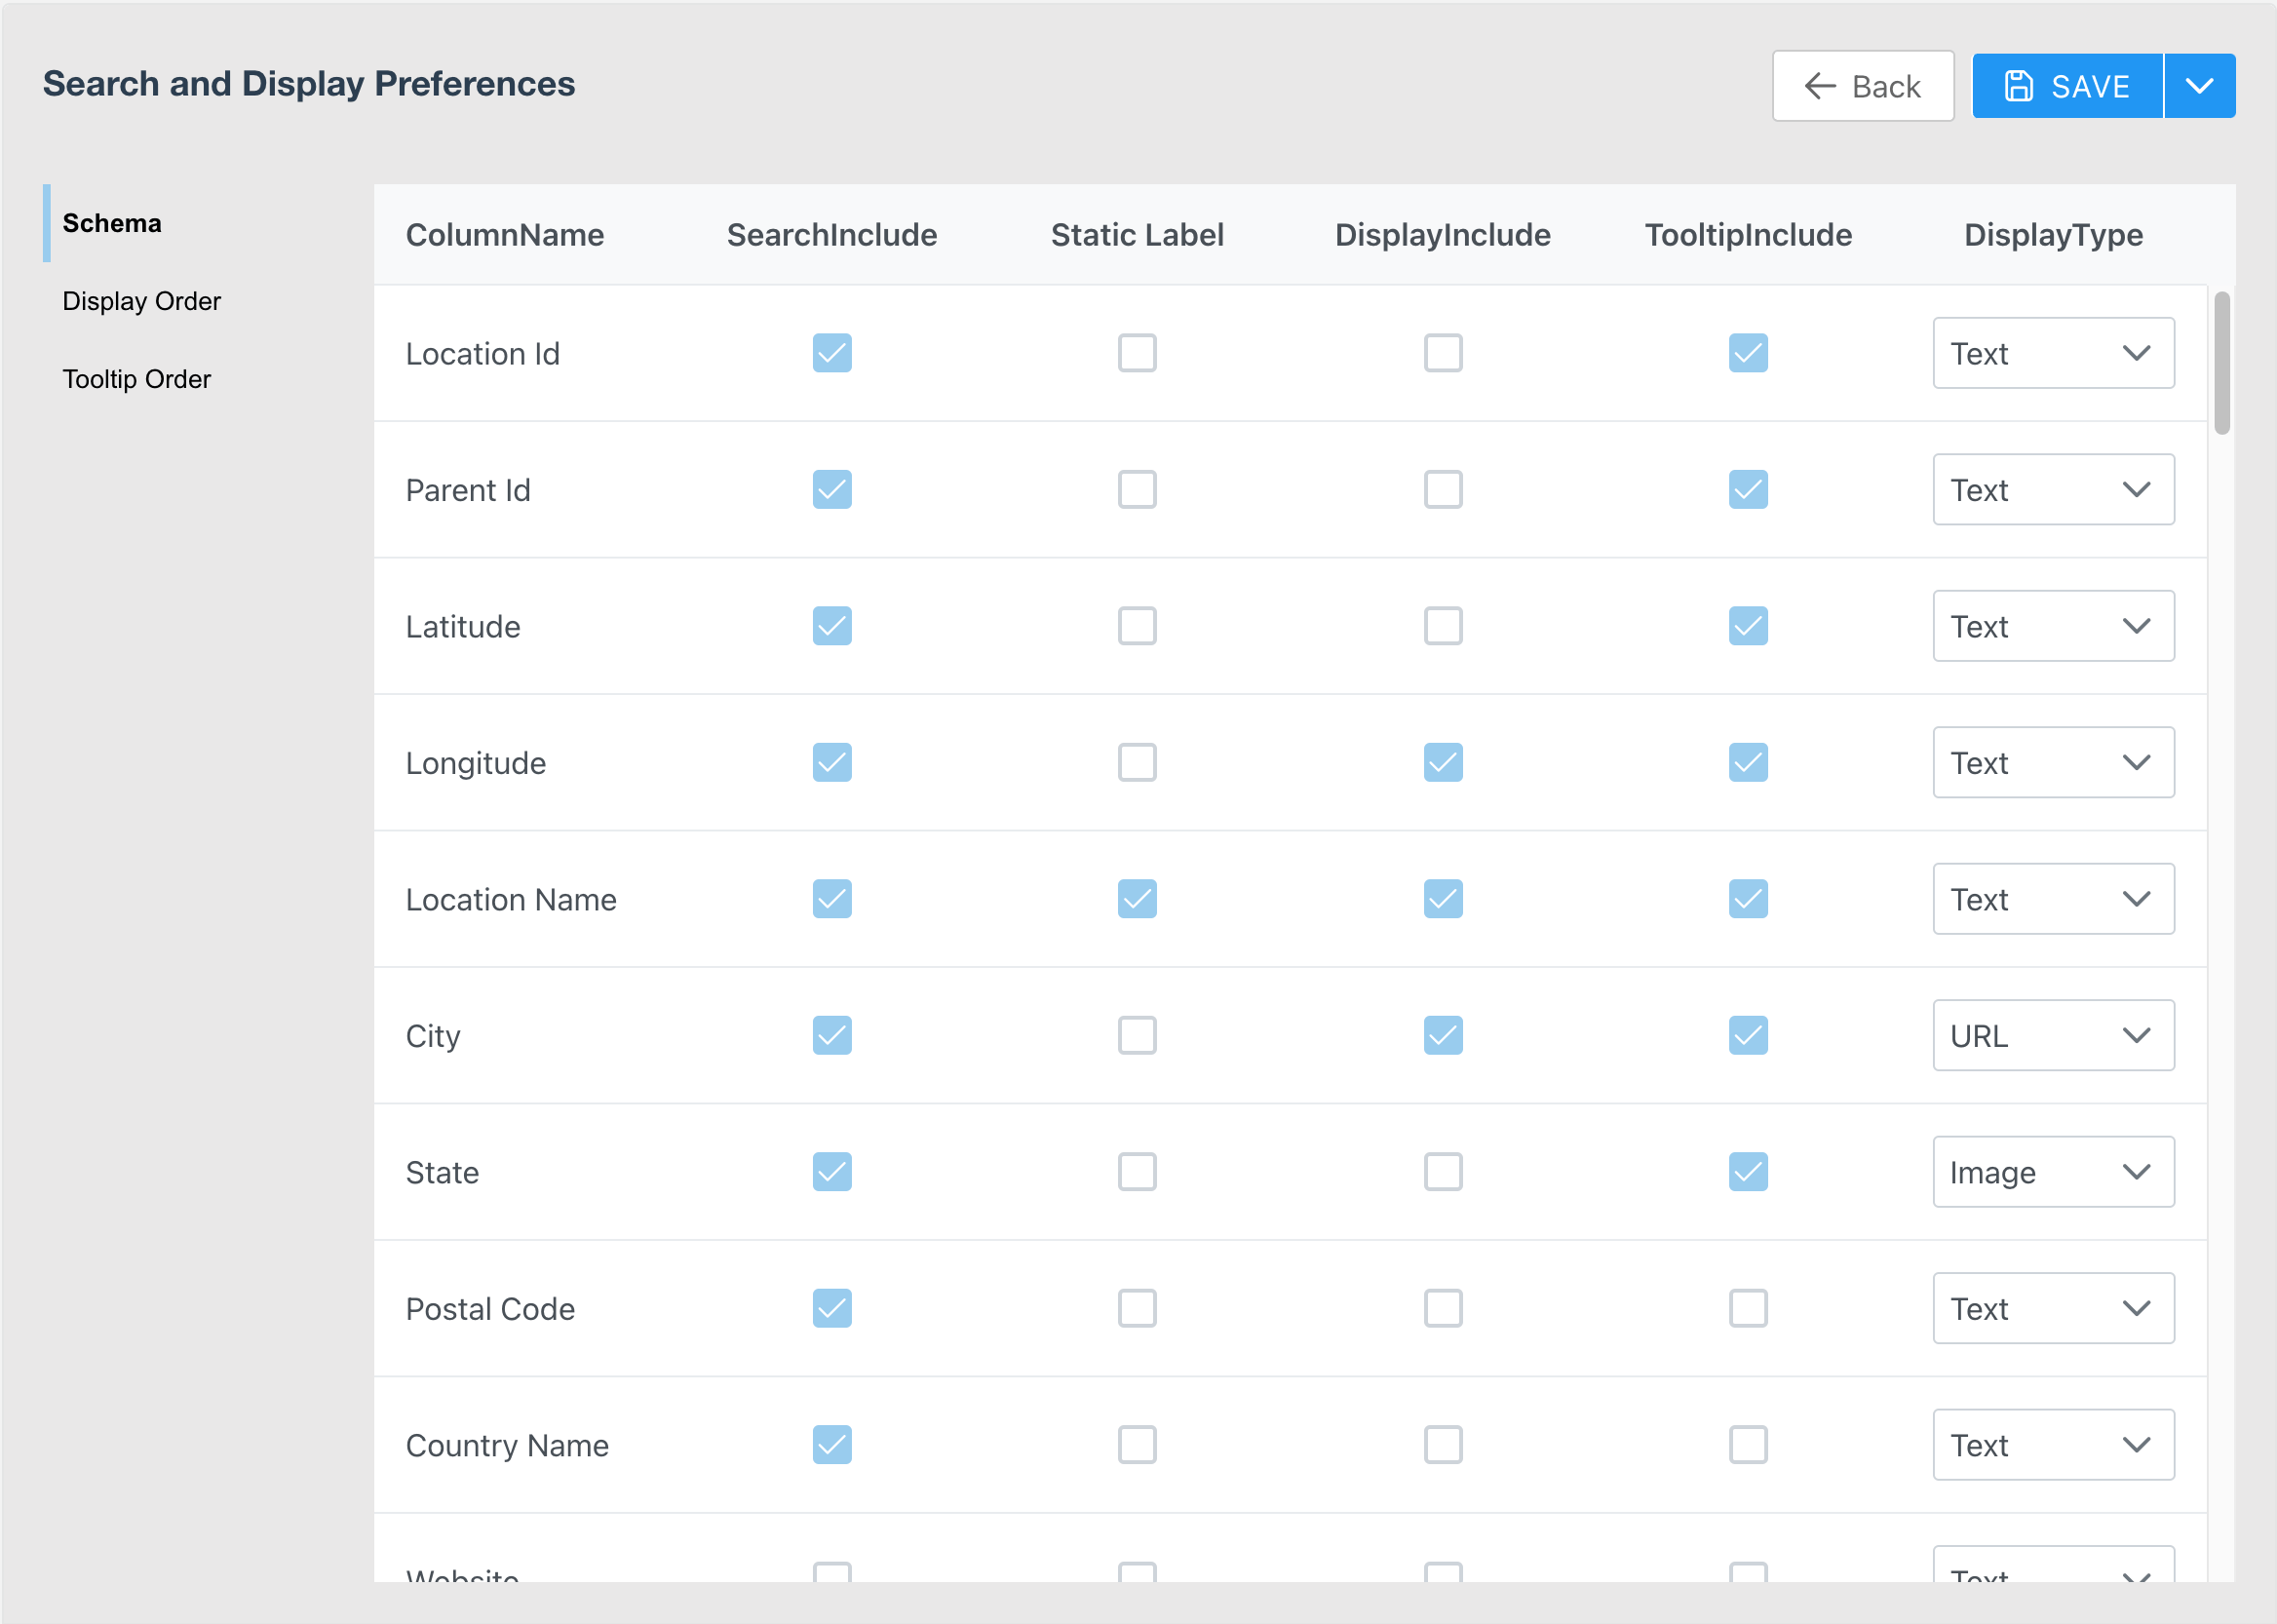
<Frame>
  <img alt="Screen Shot 2022-12-09 at 5.16.38 PM.png" src="https://mintcdn.com/domoinc-openapi-sync-dataflows/WU9_nv8qBSXeO2YZ/images/kb/ka05w0000012A9e-00N5w00000Ri7BU-0EM5w000006wG6w.jpg?fit=max&auto=format&n=WU9_nv8qBSXeO2YZ&q=85&s=b766dddb21bfcfebf44576eb7d01565f" style={{width: 770, height: 549}} width="2336" height="1666" data-path="images/kb/ka05w0000012A9e-00N5w00000Ri7BU-0EM5w000006wG6w.jpg" />
</Frame>

In the **Schema** section, you can configure what you see in and on the map from your core Locations DataSet. The Schema settings have five editable elements:

* **SearchInclude**
  is the list of fields that you want to be available in the **Pin Layers** search builder. Check the boxes for the fields you want to include.
* **Static Label**
  allows you to choose one field to display directly under the Pin on the map.
* **DisplayInclude**
  displays the chosen fields on the detail view of a selected Pin.
* **TooltipInclude**
  allows you to include the selected fields' value in the tooltip when you hover over a Pin on the map.
* **DisplayType**
  lets you tell Flex Map what type of data is in the field so it can handle special exceptions like links and images.

After you update any setting, select <InlineImage src="/images/kb/ka05w0000012Aef-00N5w00000Ri7BU-0EM5w000005wHGL.jpg" /> **Expand** and then **Save & Close** to return to the app where your updates are live.
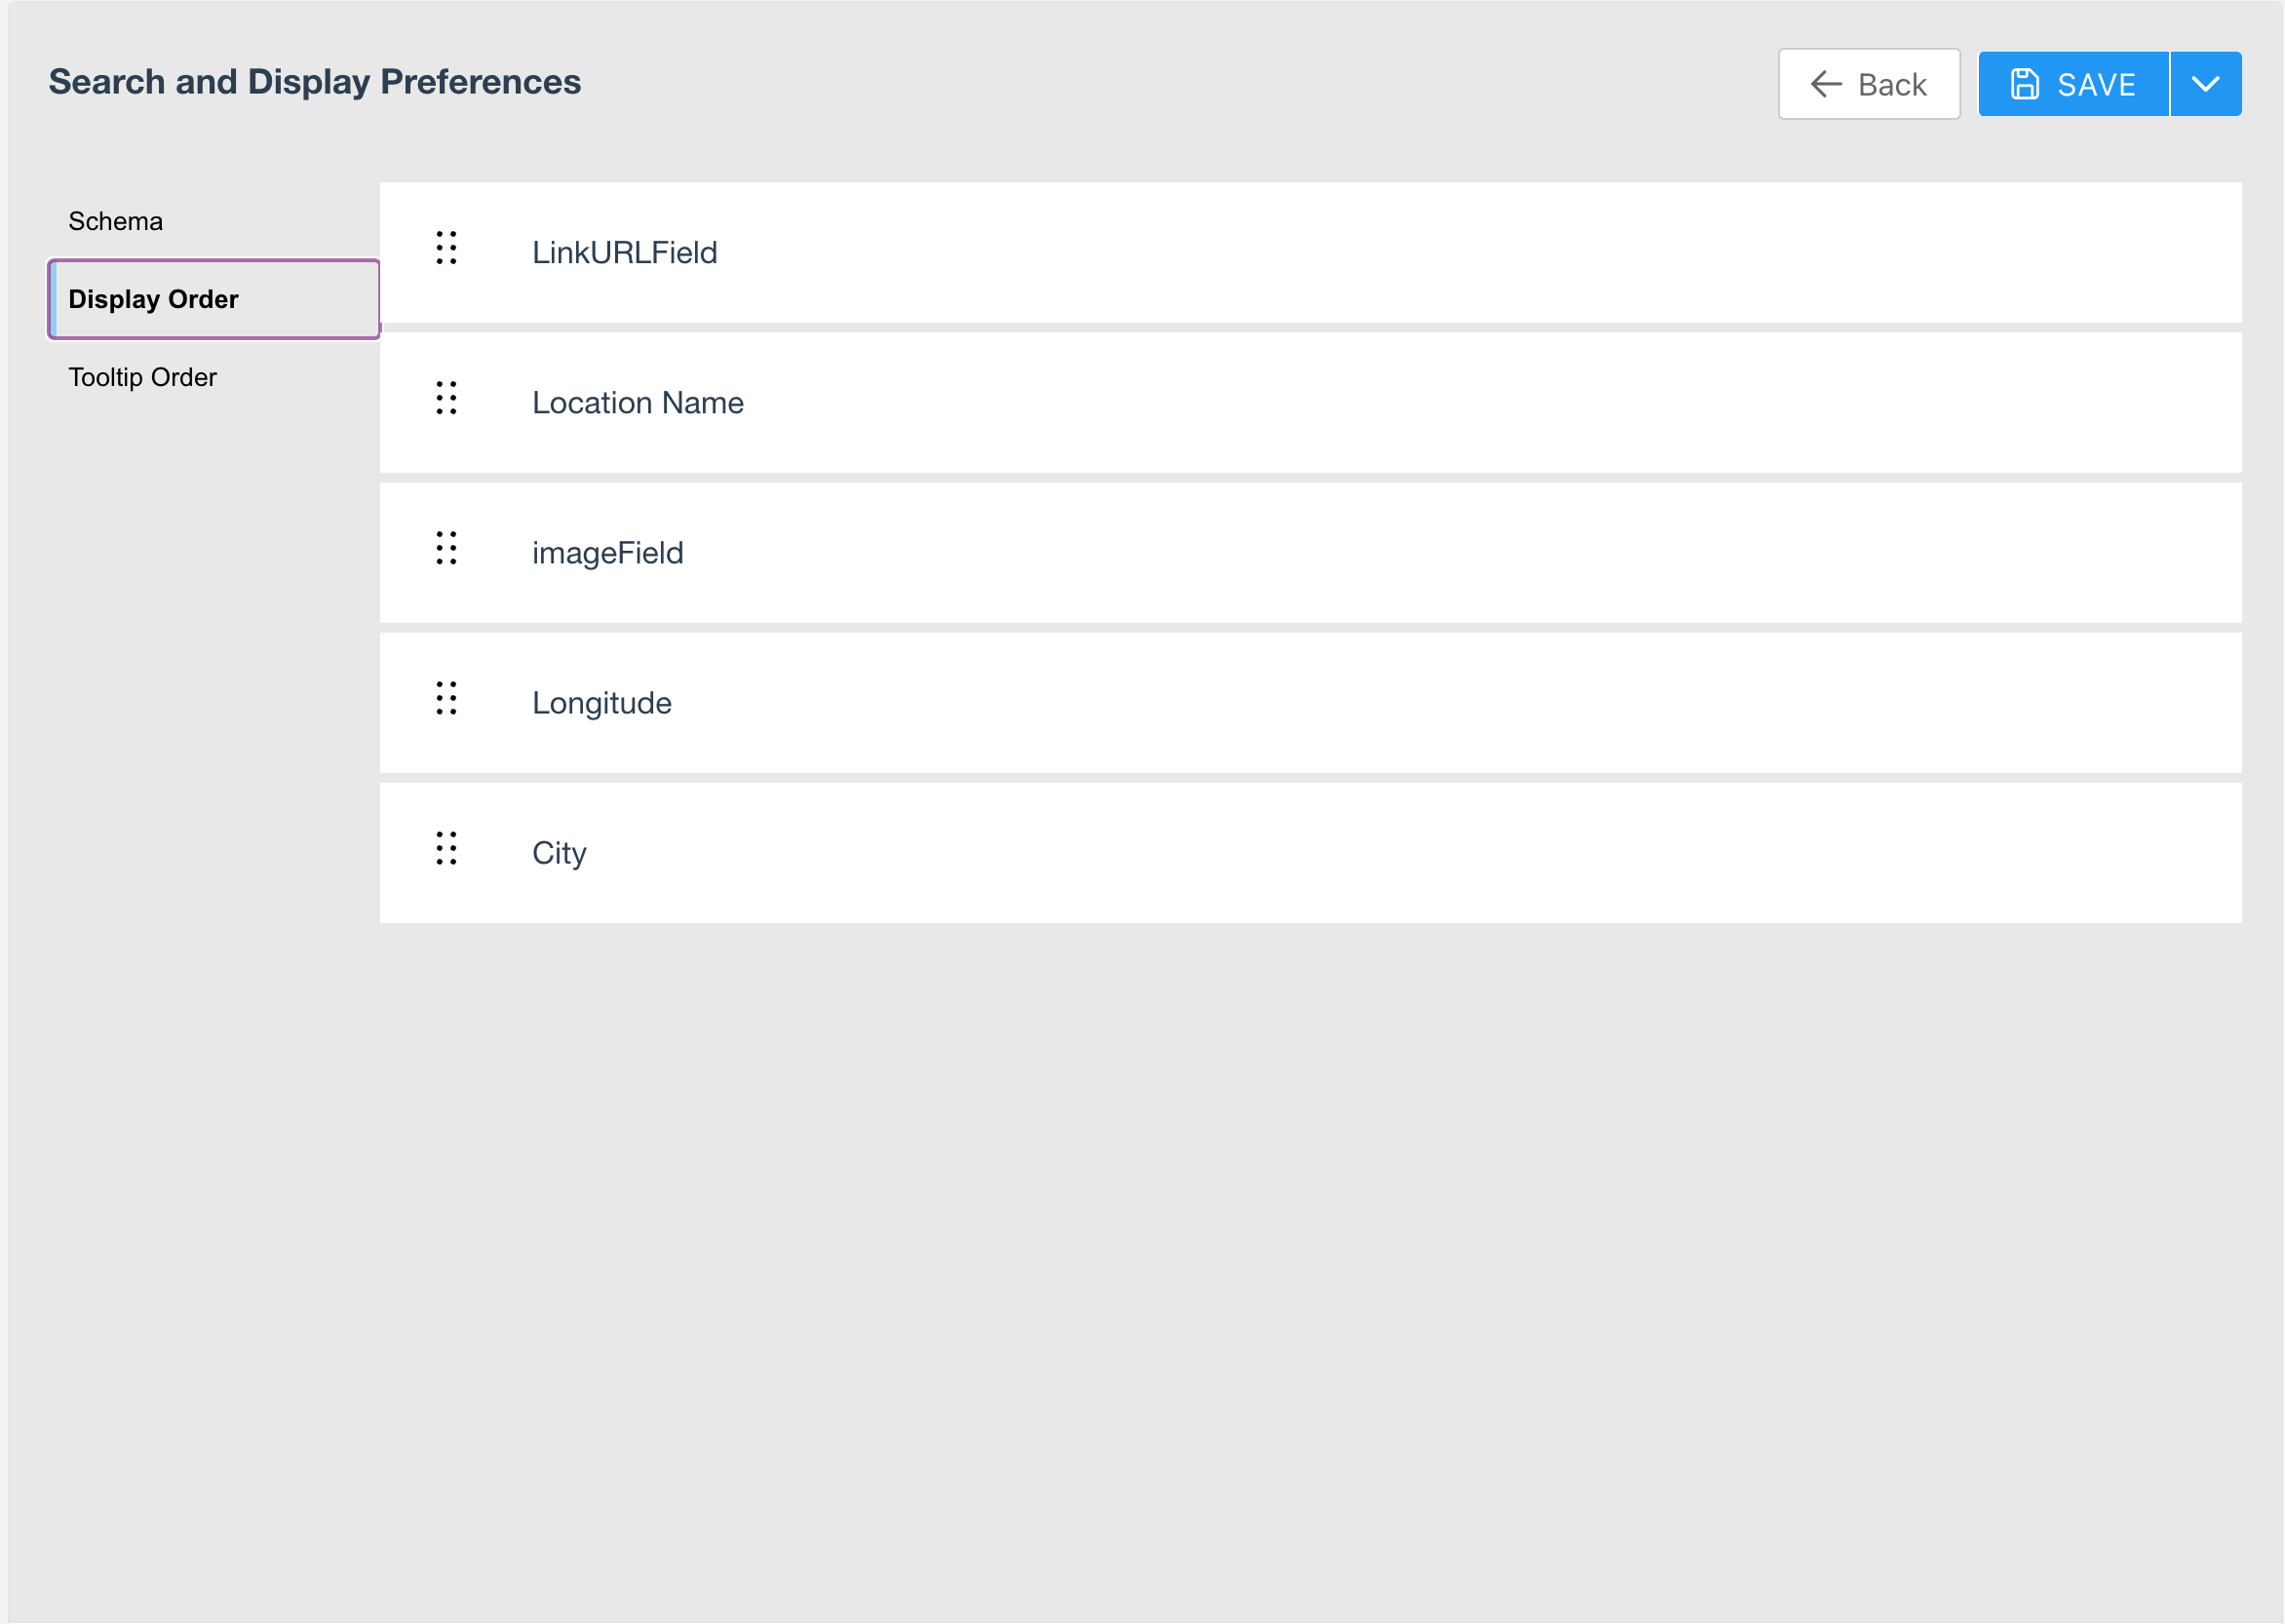
In the **Display Order** section, you can configure the order of your display fields by dragging and dropping them.

Make sure to **Save & Close**.

<Frame>
  <img alt="Screen Shot 2022-12-09 at 5.16.49 PM.png" src="https://mintcdn.com/domoinc-openapi-sync-dataflows/WU9_nv8qBSXeO2YZ/images/kb/ka05w0000012A9e-00N5w00000Ri7BU-0EM5w000006wG7B.jpg?fit=max&auto=format&n=WU9_nv8qBSXeO2YZ&q=85&s=63a854df7aae75900c050a8f5a5daaac" style={{width: 780, height: 555}} width="2344" height="1666" data-path="images/kb/ka05w0000012A9e-00N5w00000Ri7BU-0EM5w000006wG7B.jpg" />
</Frame>

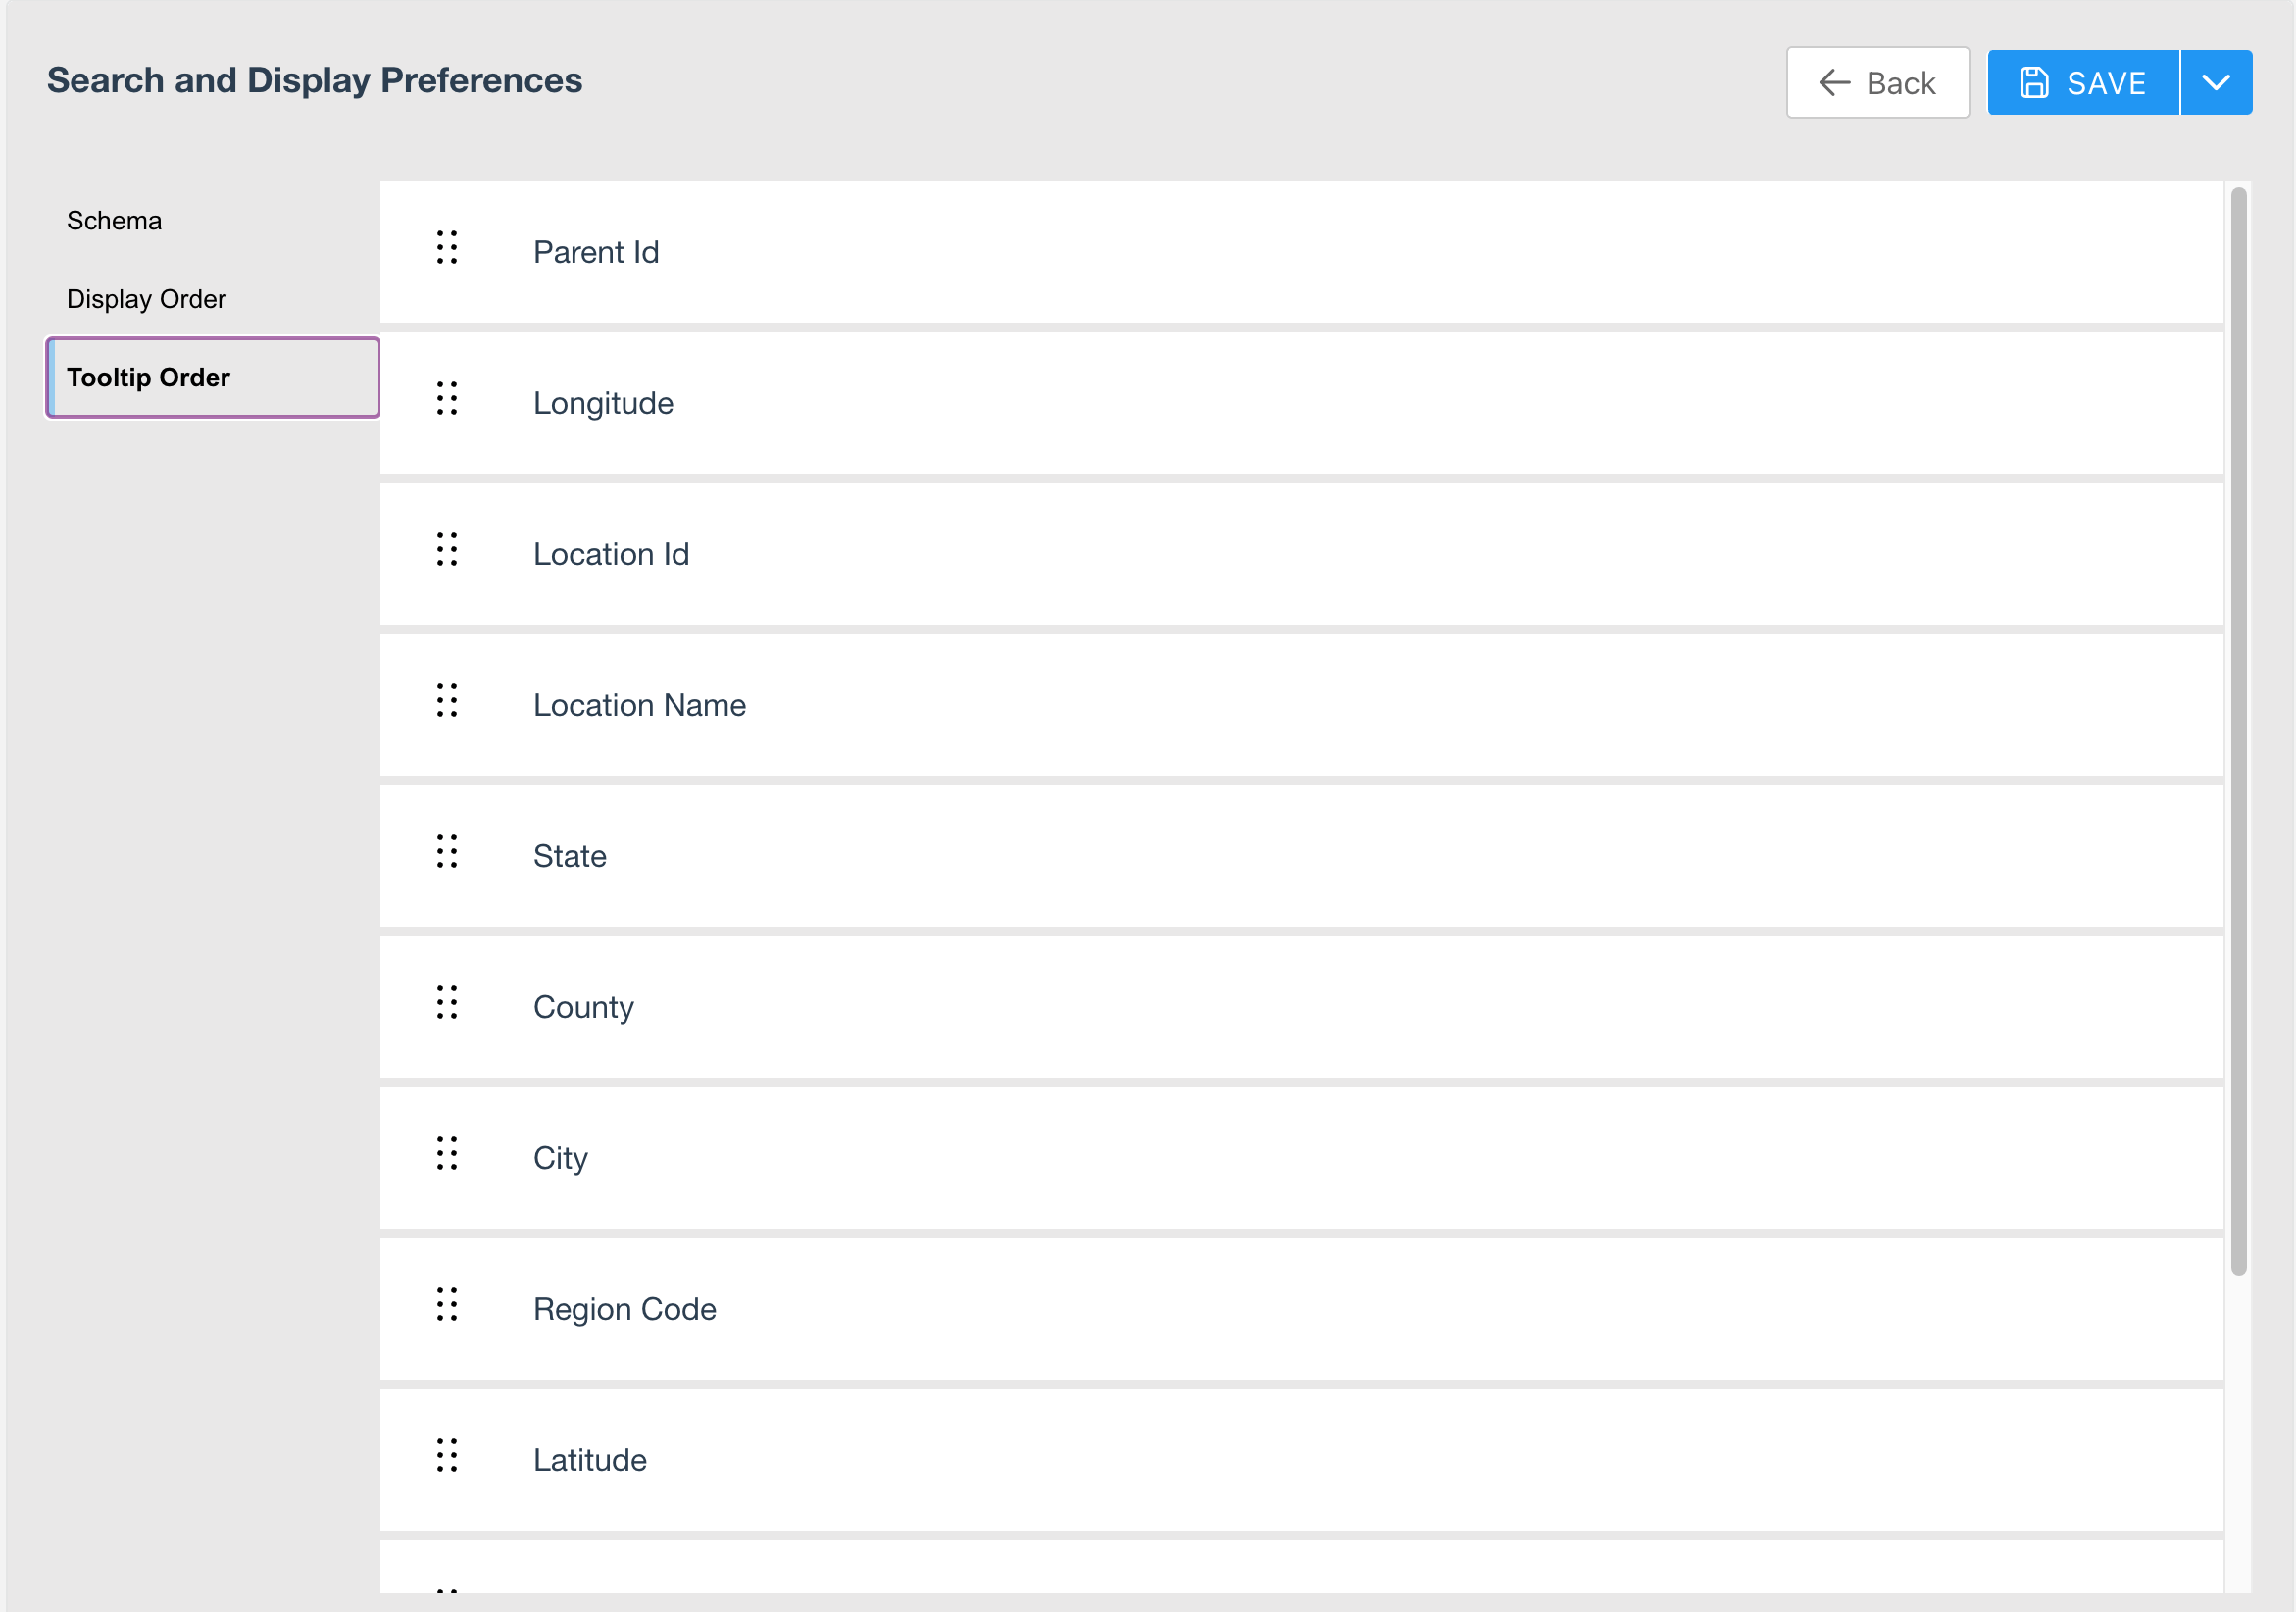
In the **Tooltip Order** section, you can also drag and drop the fields into the order that you want.

Make sure to **Save & Close **.****
<Frame>
  <img alt="Screen Shot 2022-12-09 at 5.16.58 PM.png" src="https://mintcdn.com/domoinc-openapi-sync-dataflows/WU9_nv8qBSXeO2YZ/images/kb/ka05w0000012A9e-00N5w00000Ri7BU-0EM5w000006wG7L.jpg?fit=max&auto=format&n=WU9_nv8qBSXeO2YZ&q=85&s=395ae41eb5ad4465cbbb3a5b75d64655" style={{width: 780, height: 555}} width="2342" height="1644" data-path="images/kb/ka05w0000012A9e-00N5w00000Ri7BU-0EM5w000006wG7L.jpg" />
</Frame>

### Heatmap Metric Mapping

The **Heatmap Metric Mapping** settings allow you to define and choose the metric fields you want to allow the app user to build off in the **Heatmaps** section of Flex Map v2. **Heatmap Metric Mapping** has the same three sections as **Search and Display Preferences**: **Schema**, **Display Order**, and **Tooltip Order**.
<Frame>
  <img alt="Screen Shot 2022-12-09 at 5.22.20 PM.png" src="https://mintcdn.com/domoinc-openapi-sync-dataflows/WU9_nv8qBSXeO2YZ/images/kb/ka05w0000012A9e-00N5w00000Ri7BU-0EM5w000006wG7Q.jpg?fit=max&auto=format&n=WU9_nv8qBSXeO2YZ&q=85&s=5958362d85e7e5e516372fa326bbf578" style={{width: 791, height: 563}} width="2340" height="1660" data-path="images/kb/ka05w0000012A9e-00N5w00000Ri7BU-0EM5w000006wG7Q.jpg" />
</Frame>

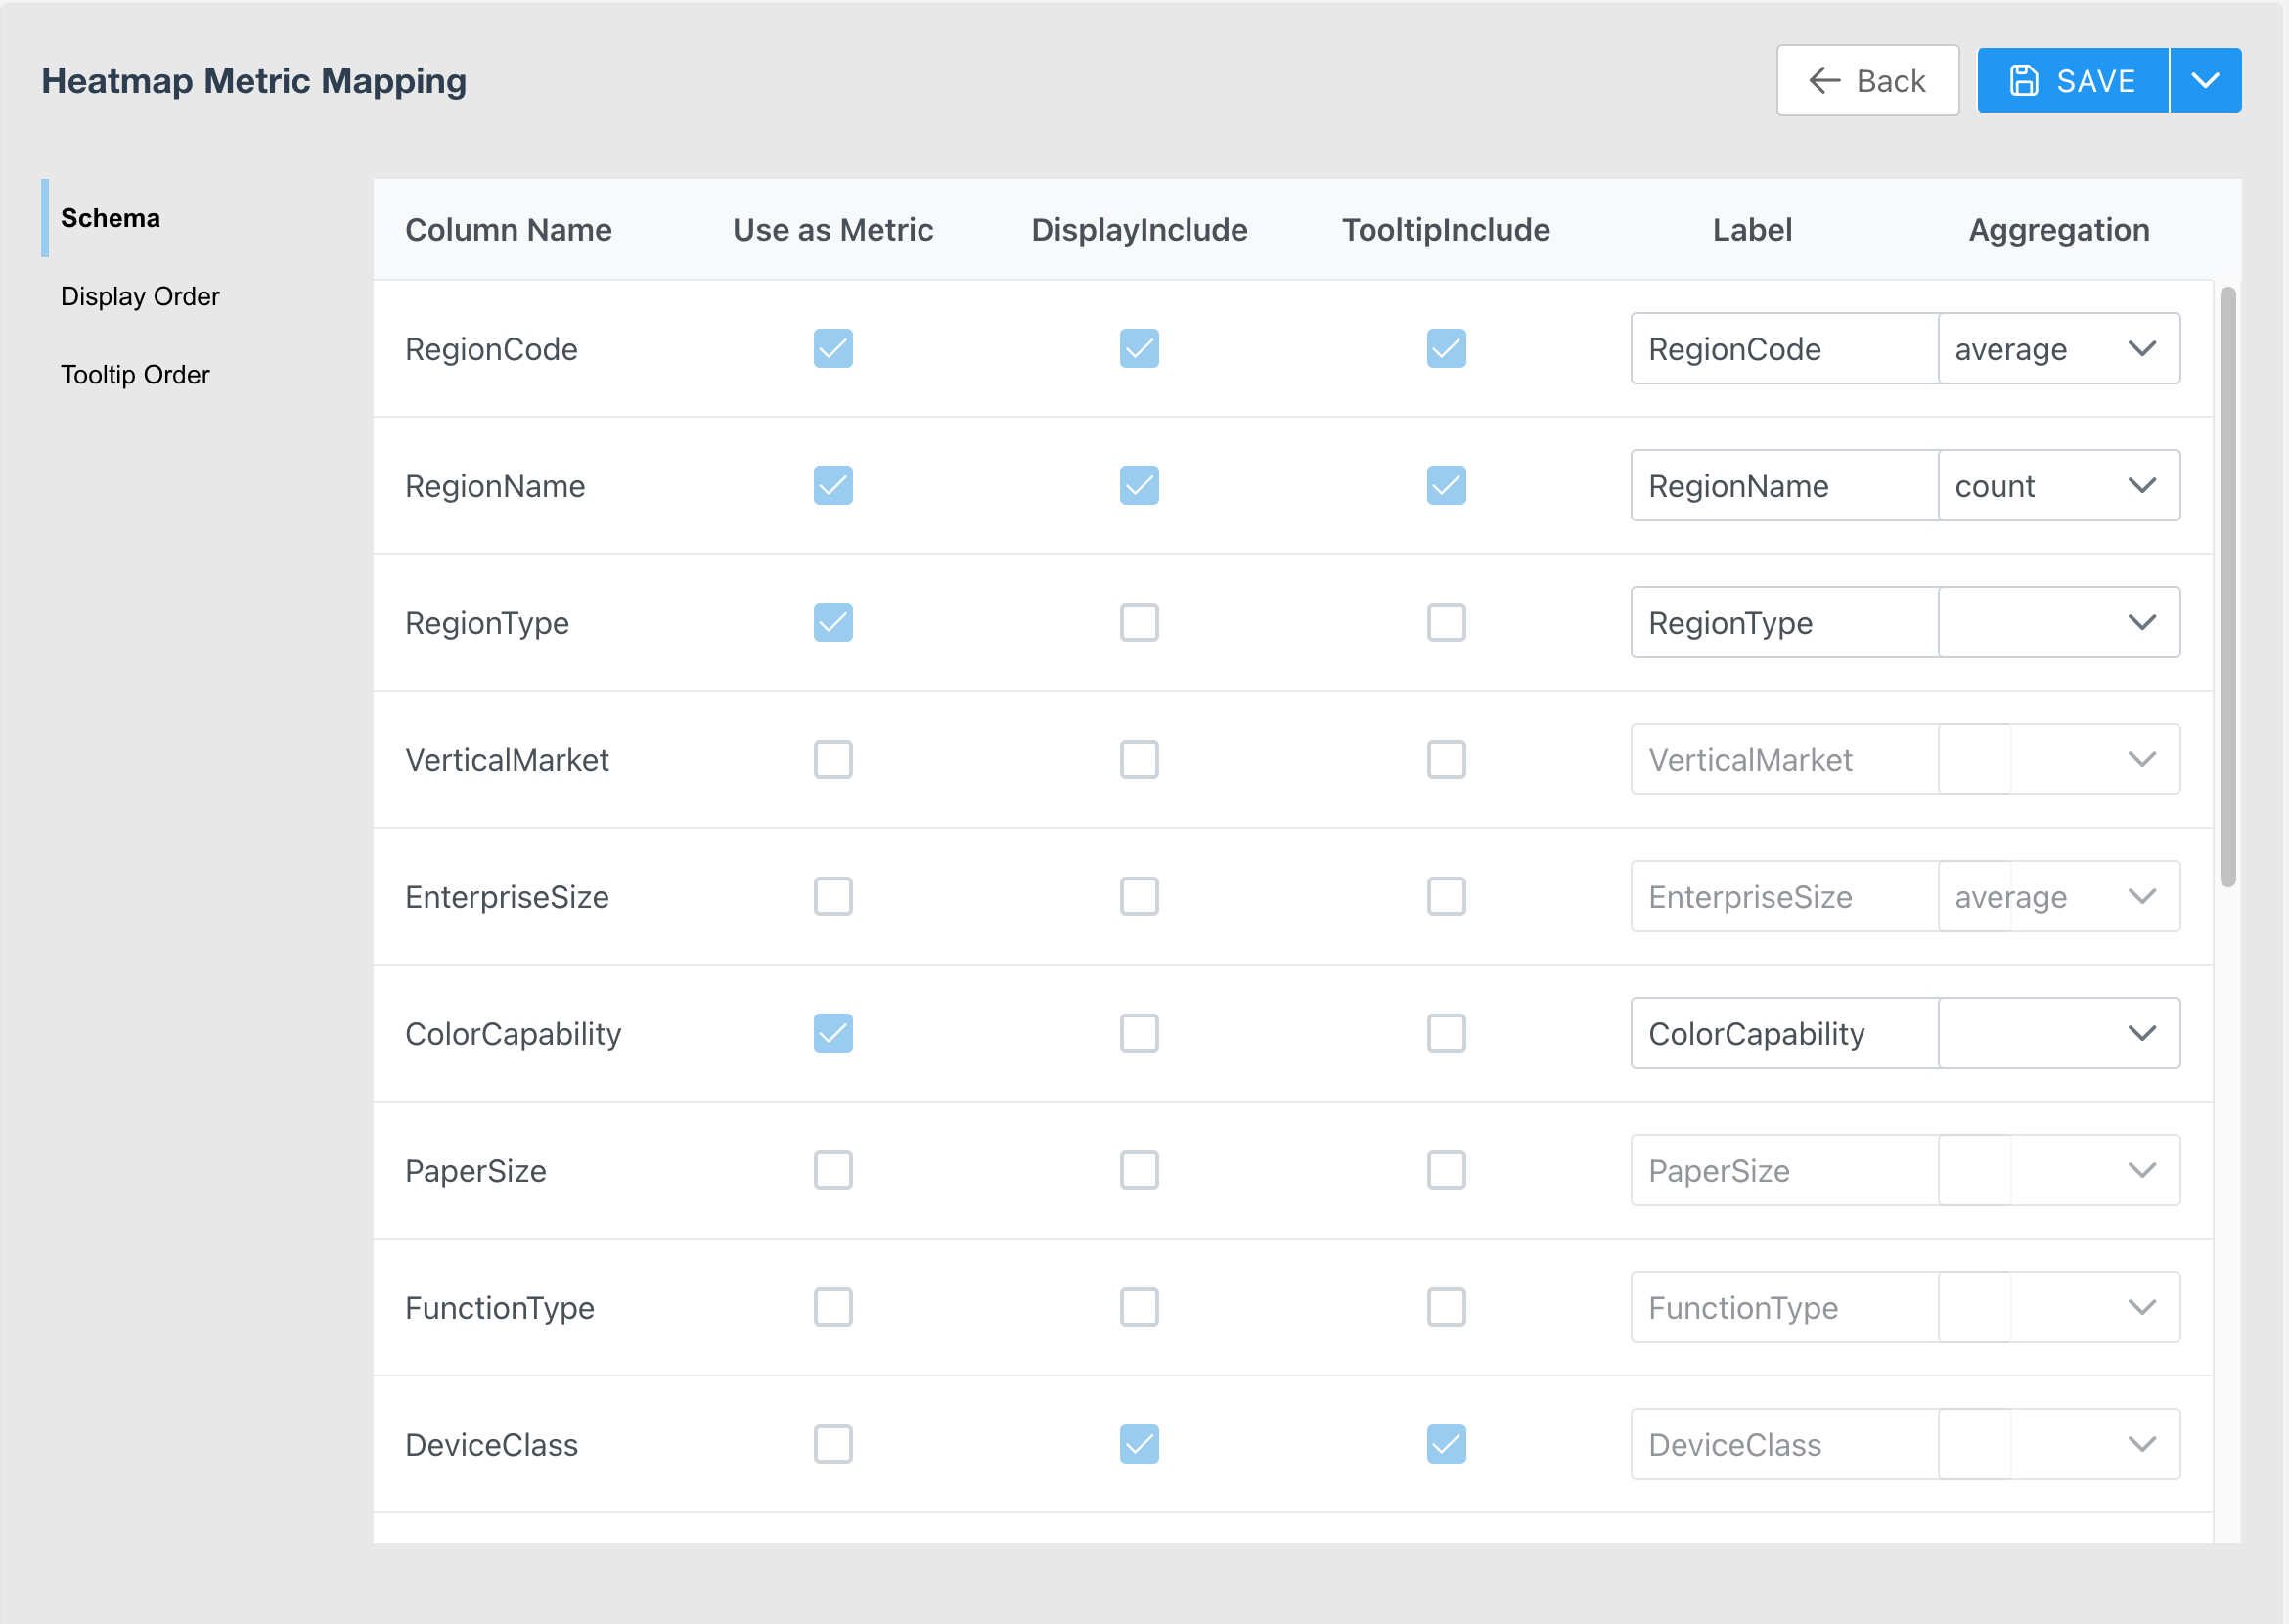
In the **Schema** section, you can configure what you see in and on the map from your Heatmaps DataSet. The **Schema** settings have five editable elements:

* **Use as Metric**
  is the list of fields that you want to use as metrics in **Heatmaps**. Check the boxes for the fields you want to include.
* **DisplayInclude**
  displays the chosen fields on the detail view of a selected Pin.
* **TooltipInclude**
  allows you to include the selected fields' value in the tooltip when you hover over a Pin on the map.
* **Label**
  allows you to rename your metrics fields for better picklist selections in the builder.
* **Aggregation**
  allows you to select the aggregation method.

After you update any setting, select <InlineImage src="/images/kb/ka05w0000012Aef-00N5w00000Ri7BU-0EM5w000005wHGL.jpg" /> **Expand** and then **Save & Close** to return to the app where your updates are live.
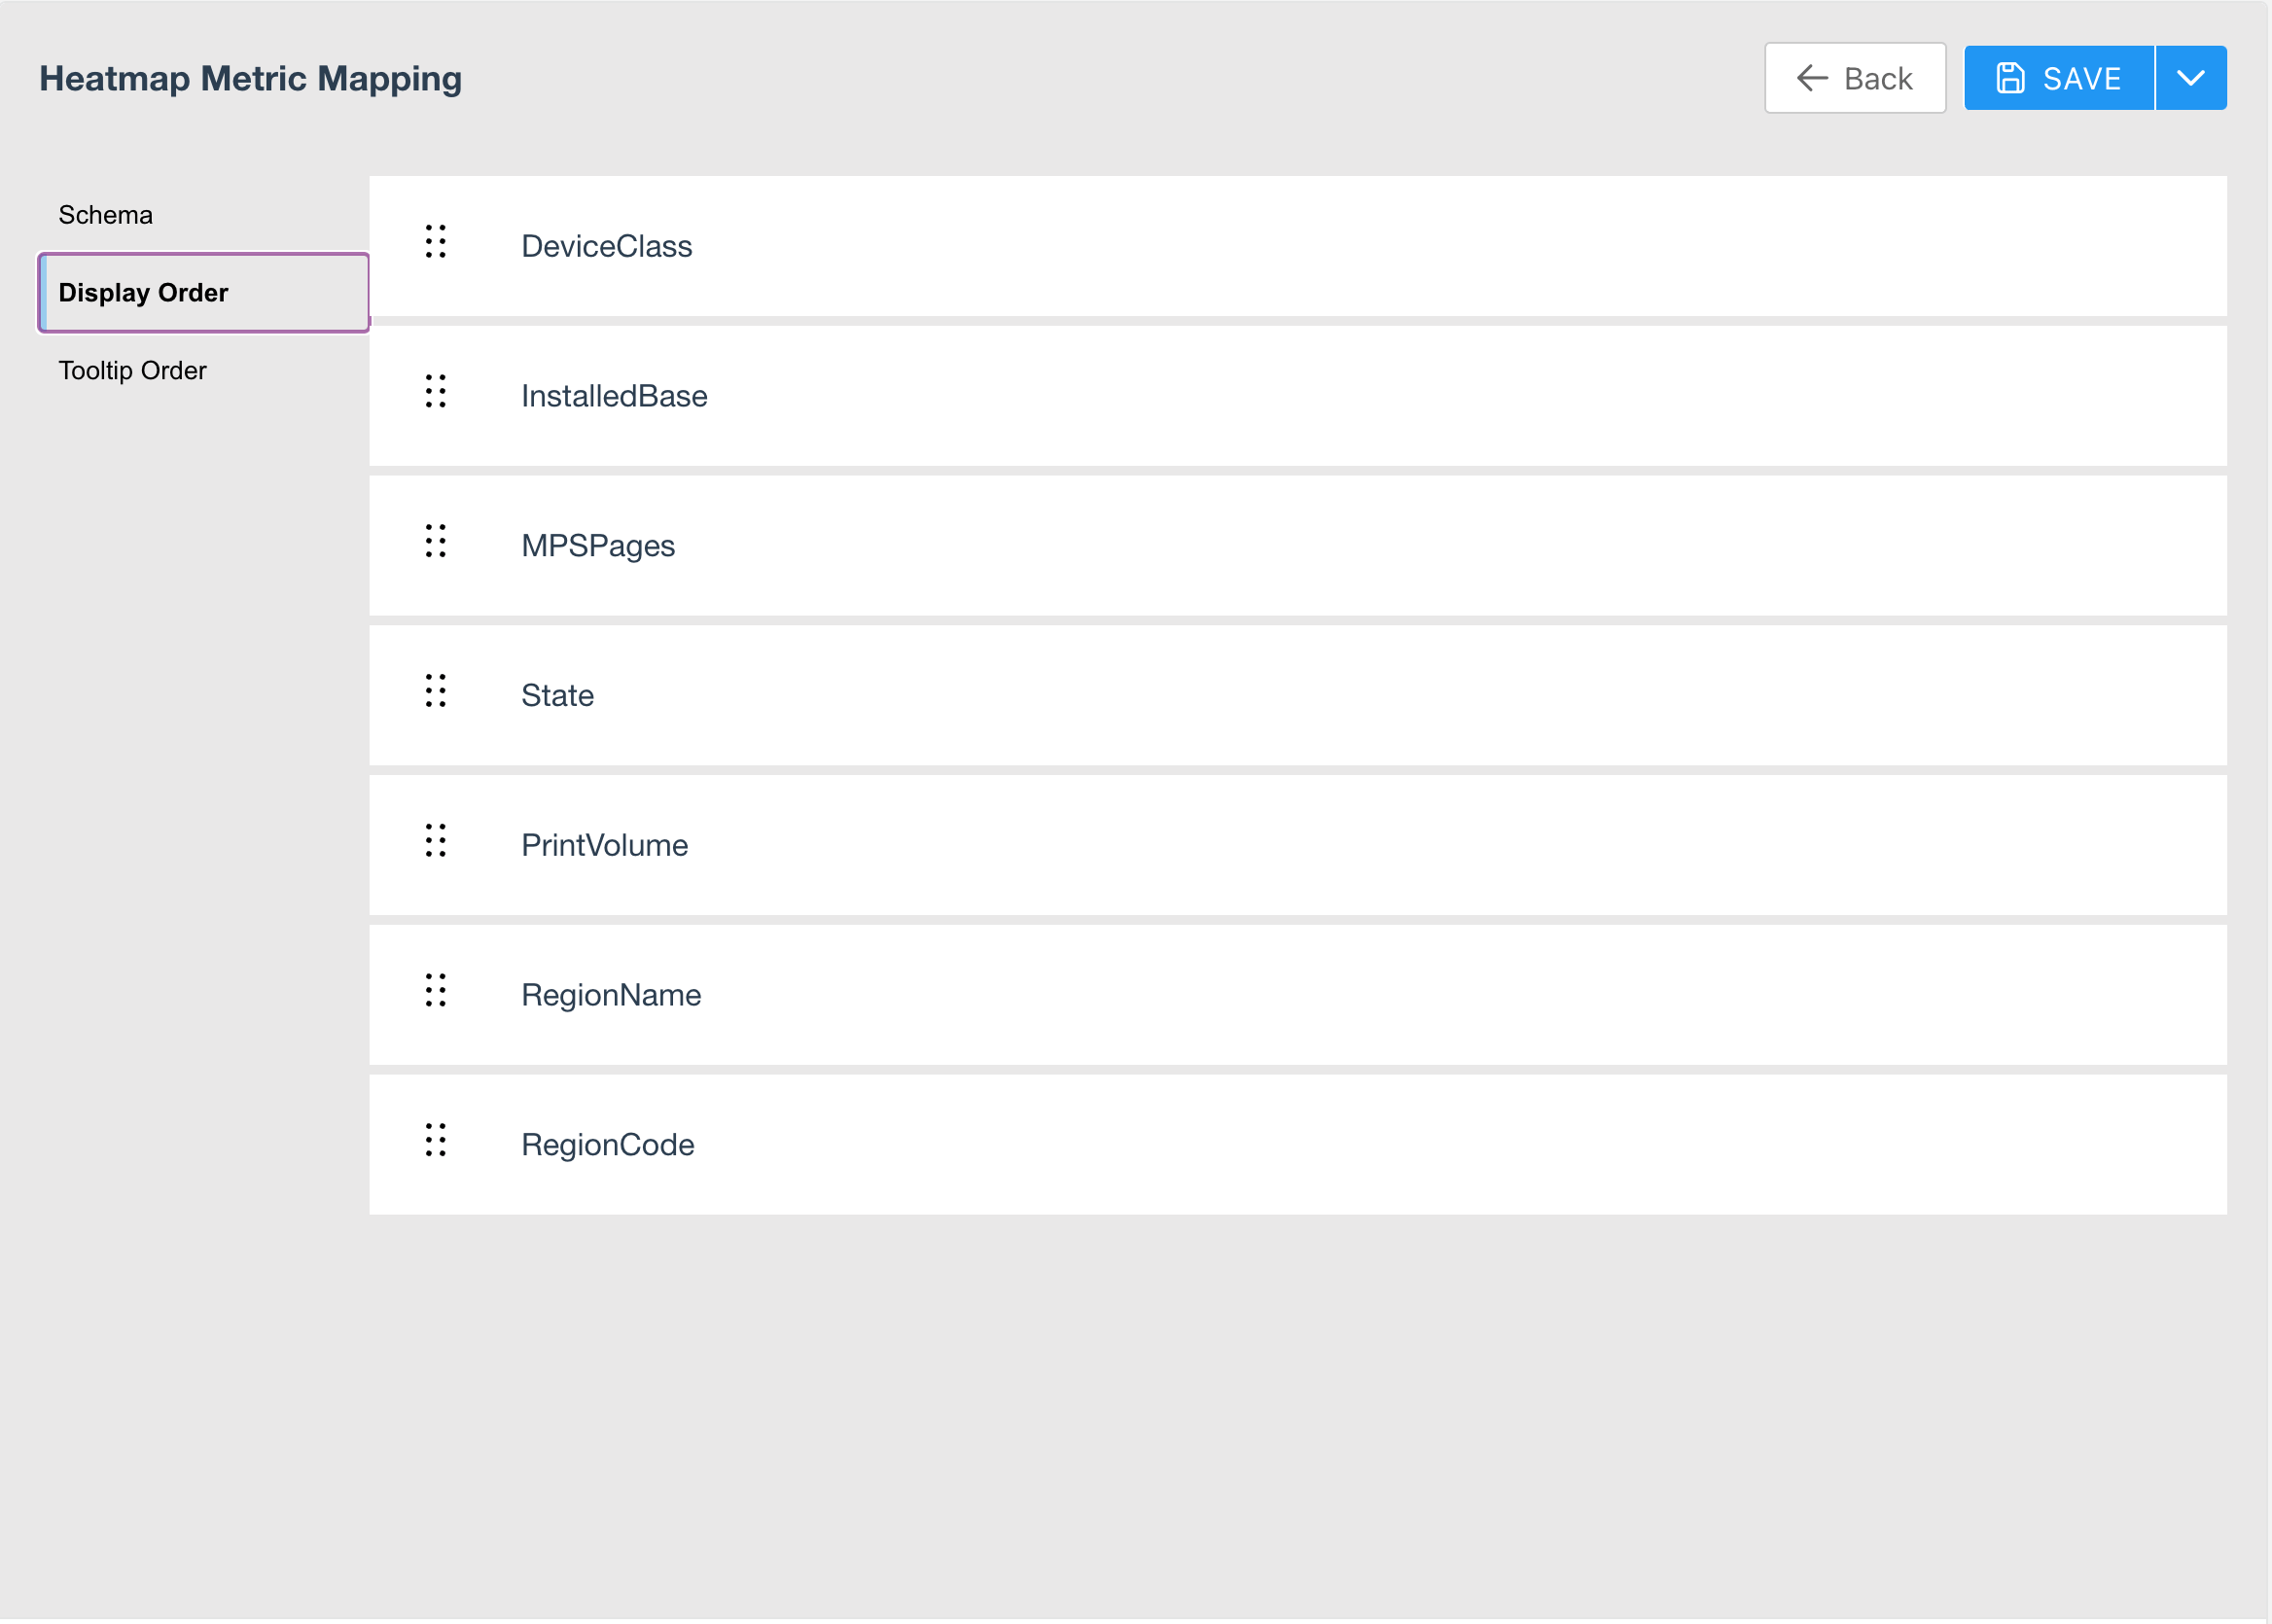
In the **Display Order** section, you can configure the order of your display fields by dragging and dropping them.

Make sure to **Save & Close**.

<Frame>
  <img alt="Screen Shot 2022-12-09 at 5.36.03 PM.png" src="https://mintcdn.com/domoinc-openapi-sync-dataflows/WU9_nv8qBSXeO2YZ/images/kb/ka05w0000012A9e-00N5w00000Ri7BU-0EM5w000006wG1x.jpg?fit=max&auto=format&n=WU9_nv8qBSXeO2YZ&q=85&s=b2ea3cec9c3a2451ced30afdd938813f" style={{width: 803, height: 570}} width="2336" height="1670" data-path="images/kb/ka05w0000012A9e-00N5w00000Ri7BU-0EM5w000006wG1x.jpg" />
</Frame>

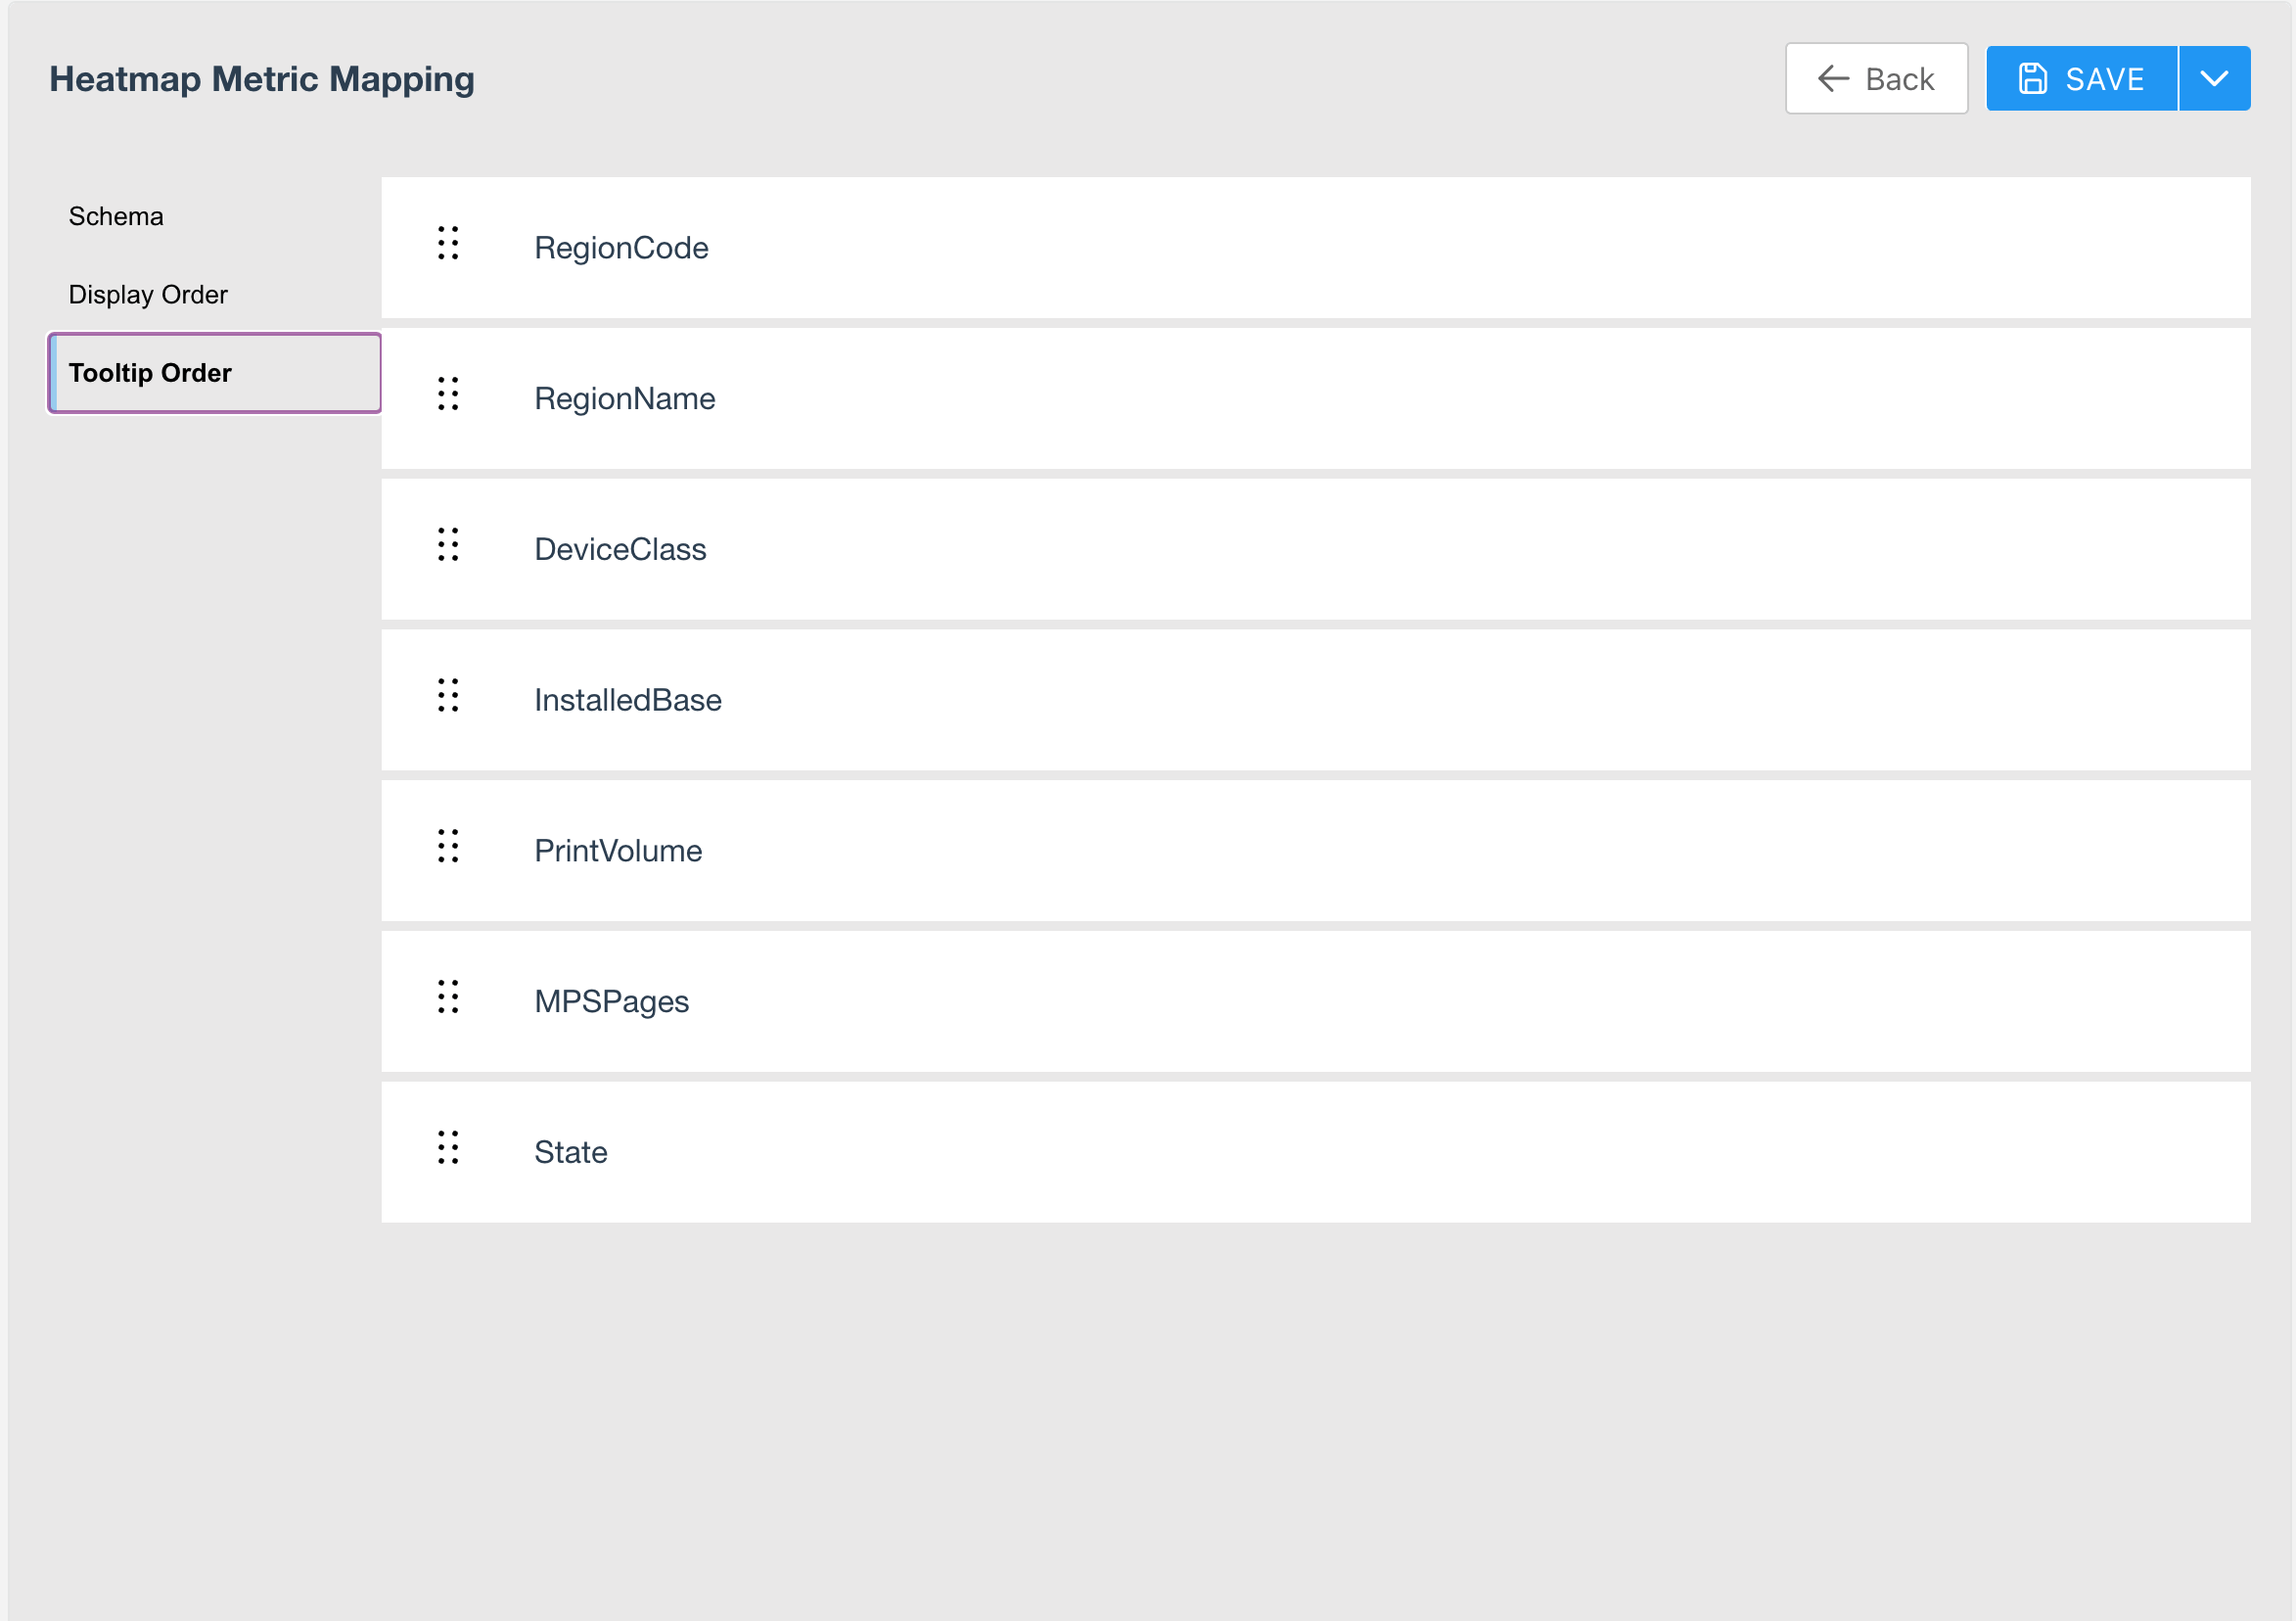
In the **Tooltip Order** section, you can also drag and drop the fields into the order that you want.

Make sure to **Save & Close **.****
<Frame>
  <img alt="Screen Shot 2022-12-09 at 5.36.12 PM.png" src="https://mintcdn.com/domoinc-openapi-sync-dataflows/WU9_nv8qBSXeO2YZ/images/kb/ka05w0000012A9e-00N5w00000Ri7BU-0EM5w000006wG7V.jpg?fit=max&auto=format&n=WU9_nv8qBSXeO2YZ&q=85&s=79f6566e34dc0519db651fd1bf7ef948" style={{width: 803, height: 570}} width="2346" height="1656" data-path="images/kb/ka05w0000012A9e-00N5w00000Ri7BU-0EM5w000006wG7V.jpg" />
</Frame>

## User Permissions and Features

The app supports three user levels: Admin, Standard, and View-only.

* Admin users can create, edit, and delete items in the app, share items they create in the app with members of Domo Groups, create custom Map Layers, and configure a default map and a default center. See
  [Map Settings](#map_settings), above.
* Standard users can create, edit, and delete their own items, and view items that admins share with them. They can't share items, create Map Layers, or set defaults.
* View-only users can view items that admins share with them. They can't create, edit, or delete items. They also cannot share items or set defaults.

To learn more, see the [Flex Map v2 Implementation Guide](http://domo-support.domo.com/s/article/000005073?language=en_US).

## Interacting with the Map

After you create searches, Map Layers, and Heatmaps, you can interact with these items on the map.

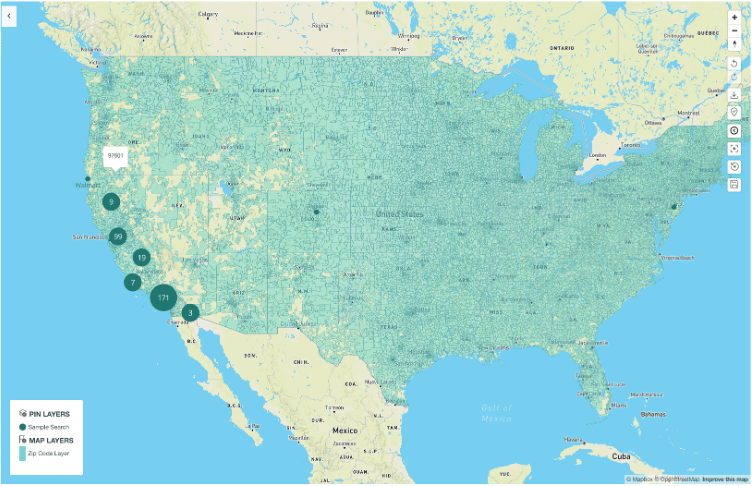
Searches display as colored dots on the map called Pins. If a Pin represents an individual location, it is a small dot without a number in the middle. If it represents a cluster of locations, the dot is larger and has a number in the middle representing the number of grouped locations.
<Frame>
  <img alt="interacting.png" src="https://mintcdn.com/domoinc-openapi-sync-dataflows/WU9_nv8qBSXeO2YZ/images/kb/ka05w0000012A9e-00N5w00000Ri7BU-0EM5w000006wG7a.jpg?fit=max&auto=format&n=WU9_nv8qBSXeO2YZ&q=85&s=57e2dbf8c9fa8d5831cbbe26b3d19bbc" style={{width: 616, height: 398}} width="752" height="486" data-path="images/kb/ka05w0000012A9e-00N5w00000Ri7BU-0EM5w000006wG7a.jpg" />
</Frame>

* Zoom into a clustered Pin to see the distinct locations.
* Selecting a clustered Pin zooms into that location by one level.
* Selecting an individual Pin opens a details panel that shows additional information for that location. If the additional information includes URLs, the URLs are colored orange and are clickable. If the additional information includes a link to an image, the image displays in the details panel.
* Hovering over an individual Pin displays a tooltip for that location which card owners and admins can configure in the
  [**Data Settings**](#data_settings).

Map Layers display on the map as a filled-in border around the geographical area.

* Hovering over the territory displays the name of the location you are hovering over. Heatmaps display as multi-colored areas filled in with colors representing the value of the Heatmap metric.
* Hovering over the Heatmap displays a tooltip with the metric that the color of the area represents.
* Selecting a Heatmap area brings up a tooltip showing all related Heatmap metrics for that area.
* A legend of what each of the Heatmap's colors represents displays in the lower-left corner of the map.

Enter a term in the search bar at the top of the screen to view all the Pins that match your search entry.

You can use this to quickly find a single location, a group of locations, or to create a favorite by selecting the star next to the location in the search results.

<Note>
  **Note:** Admins see options to **Set as Default** and **Set as Center** at the bottom of the app.

  * Selecting
    **Set as Default** saves any displayed searches, Map Layers, and Heatmaps as the map default. This means that any user who loads the app views these default items when the app loads, as long as the items have been shared with them.
  * Selecting
    **Set as Center** sets the current view of the map as the default center. This means, for example, that an admin can set the contiguous United States as the default view, zoom in, and then save the revised view so that other users view it when they open the app.
</Note>

## Demo Notes

One way to demo the app is to upload a DataSet to power pin locations based on lat/long and Heatmap metrics.

Then show how to build territories and save searches and Heatmaps.