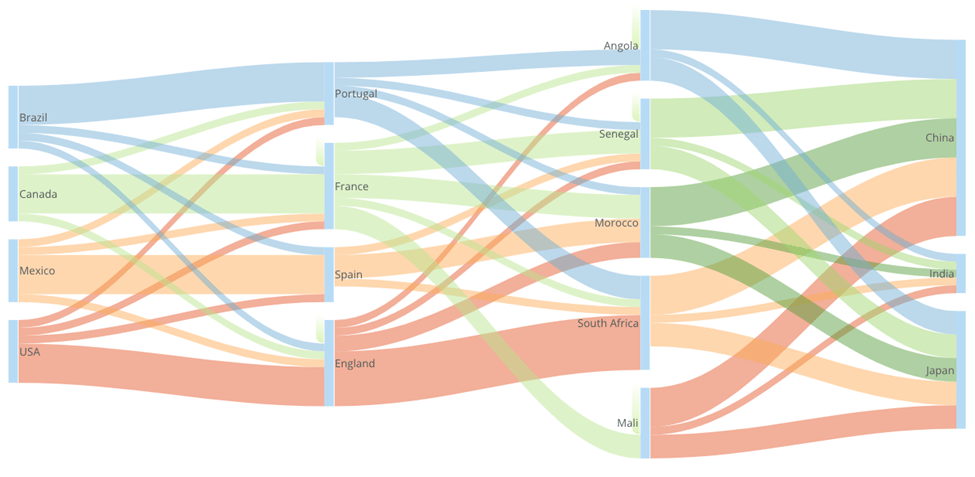
 The original Sankey chart is ideal for physical flows that go to a destination once per flow, like energy and materials. However, it's not ideal for recursive concepts like web traffic, where flows need to circle back to previous nodes and require special treatment to display properly. To meet these needs, Domo has created the circular Sankey chart.
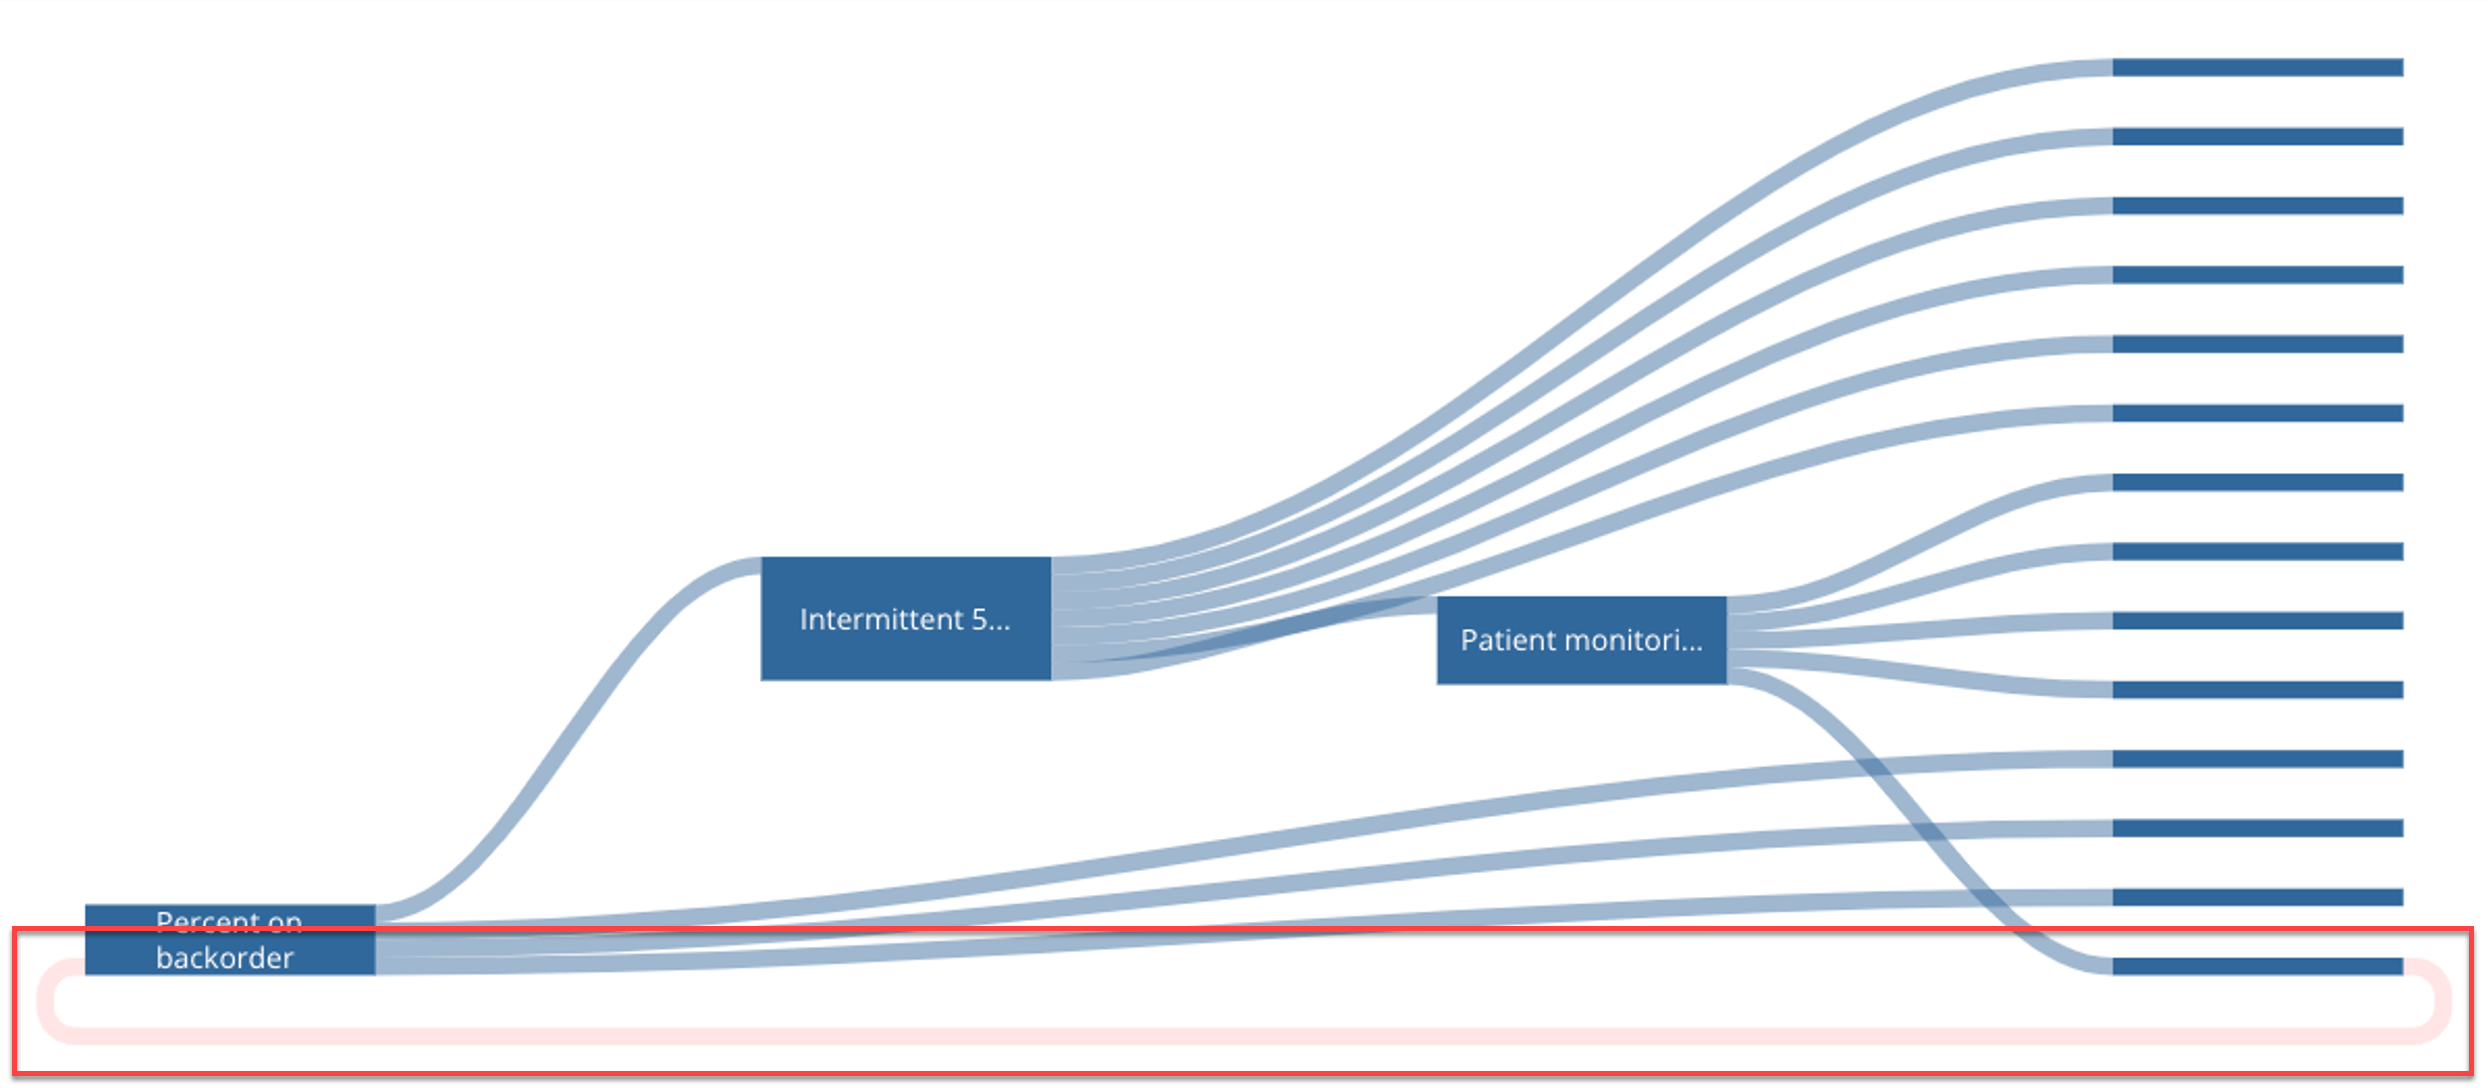
The following image emphasizes the chart's circular reference:
The original Sankey chart is ideal for physical flows that go to a destination once per flow, like energy and materials. However, it's not ideal for recursive concepts like web traffic, where flows need to circle back to previous nodes and require special treatment to display properly. To meet these needs, Domo has created the circular Sankey chart.
The following image emphasizes the chart's circular reference:
 ## Powering Circular Sankey Charts
A circular Sankey chart requires each of the following:
* **A `From` dimension** — The source of the flow.
* **A `To` dimension** — The destination of the flow.
* **A value** — The size of the flow.
For information about value, category, and series data, see our [Understanding Chart Data](https://domo-support.domo.com/s/article/360043428693?language=en_US) article.
In Analyzer, you can choose the columns containing the data for your circular Sankey chart. For more information about choosing data columns, see our article about [Applying DataSet Columns to Your Chart](https://domo-support.domo.com/s/article/360043428713?language=en_US).
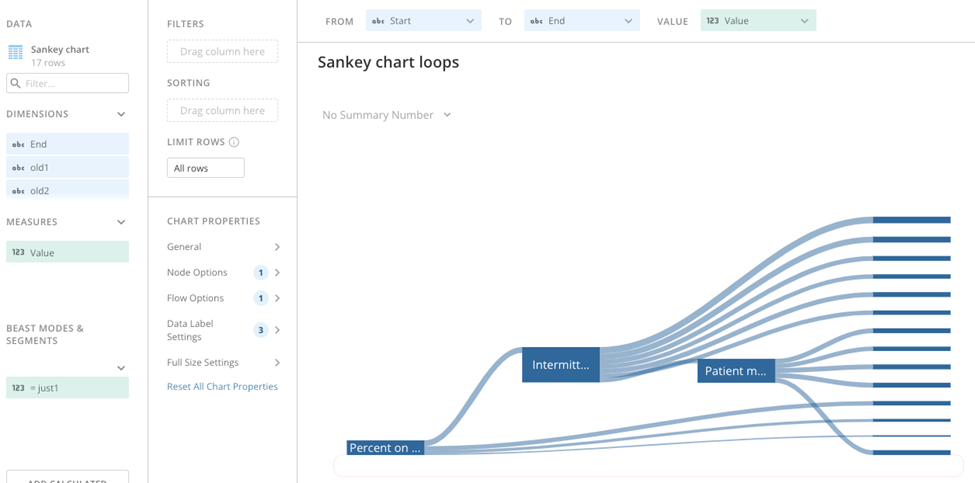
The following image shows how data from a typical column-based spreadsheet is converted into a circular Sankey chart:
## Powering Circular Sankey Charts
A circular Sankey chart requires each of the following:
* **A `From` dimension** — The source of the flow.
* **A `To` dimension** — The destination of the flow.
* **A value** — The size of the flow.
For information about value, category, and series data, see our [Understanding Chart Data](https://domo-support.domo.com/s/article/360043428693?language=en_US) article.
In Analyzer, you can choose the columns containing the data for your circular Sankey chart. For more information about choosing data columns, see our article about [Applying DataSet Columns to Your Chart](https://domo-support.domo.com/s/article/360043428713?language=en_US).
The following image shows how data from a typical column-based spreadsheet is converted into a circular Sankey chart:
 ## Customizing Circular Sankey Charts
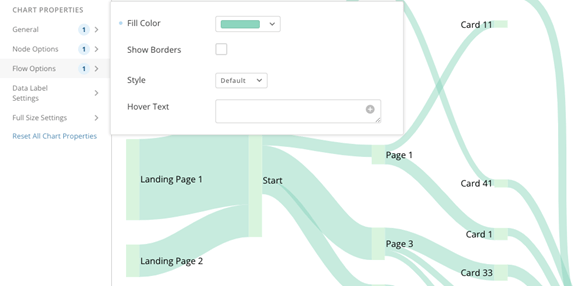
You can customize the appearance of a circular Sankey chart in several ways, many of which are possible with the **Chart Properties** tool. For more information, see our [Chart Properties](https://domo-support.domo.com/s/article/360042925374?language=en_US) article.
## Customizing Circular Sankey Charts
You can customize the appearance of a circular Sankey chart in several ways, many of which are possible with the **Chart Properties** tool. For more information, see our [Chart Properties](https://domo-support.domo.com/s/article/360042925374?language=en_US) article.
Property
Description
Example
General > Value Format
Determines whether currency symbols are appended to values.
—
General > Value Decimal Places
Determines the number of decimal places in values.
—
General > Percent Value Decimal Places
Determines the number of decimal places in percent values.
—
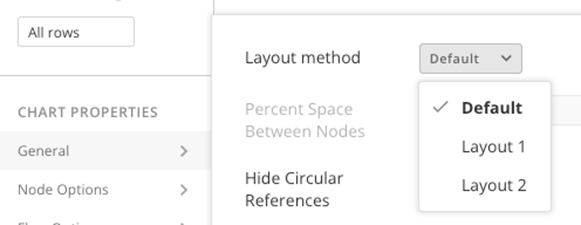
General > Layout method
Allows you to select different layouts for your Sankey data. You can see which one works best for your data.
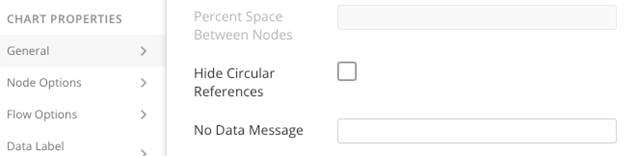
General > Hide Circular
Allows you to hide circular references in the chart.
When you select this checkbox, the chart handles recursion but doesn't display the loops back.
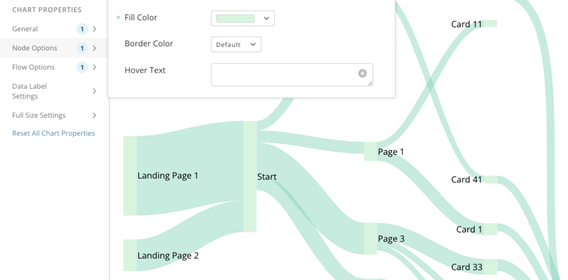
Node Options
Allows you to set the fill and border colors for nodes.
Flow Options
Allows you to set the fill and border colors for flows.