> ## Documentation Index
> Fetch the complete documentation index at: https://domoinc-openapi-sync-dataflows.mintlify.site/llms.txt
> Use this file to discover all available pages before exploring further.

# Variance Chart

## Intro

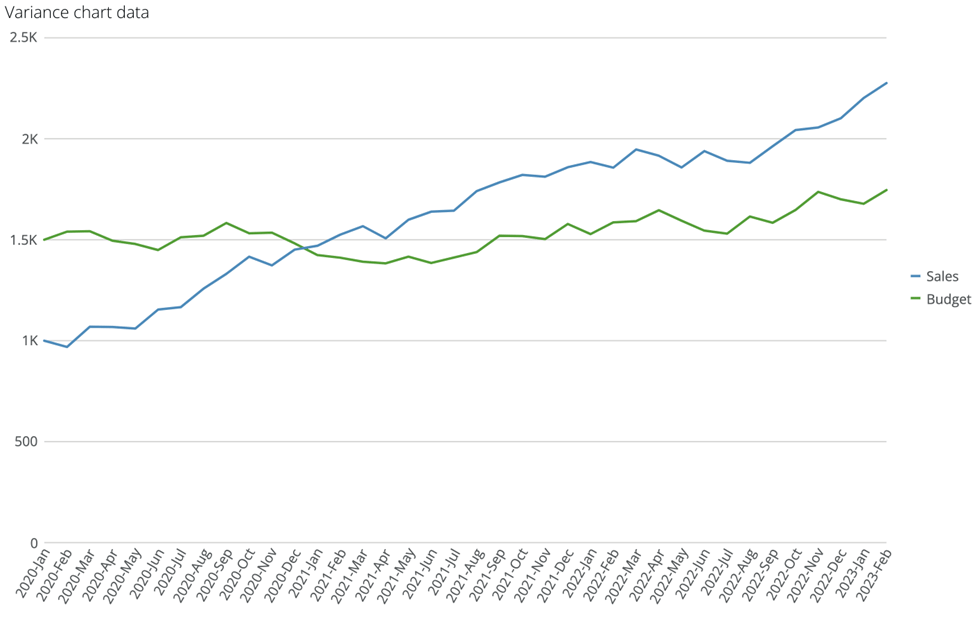
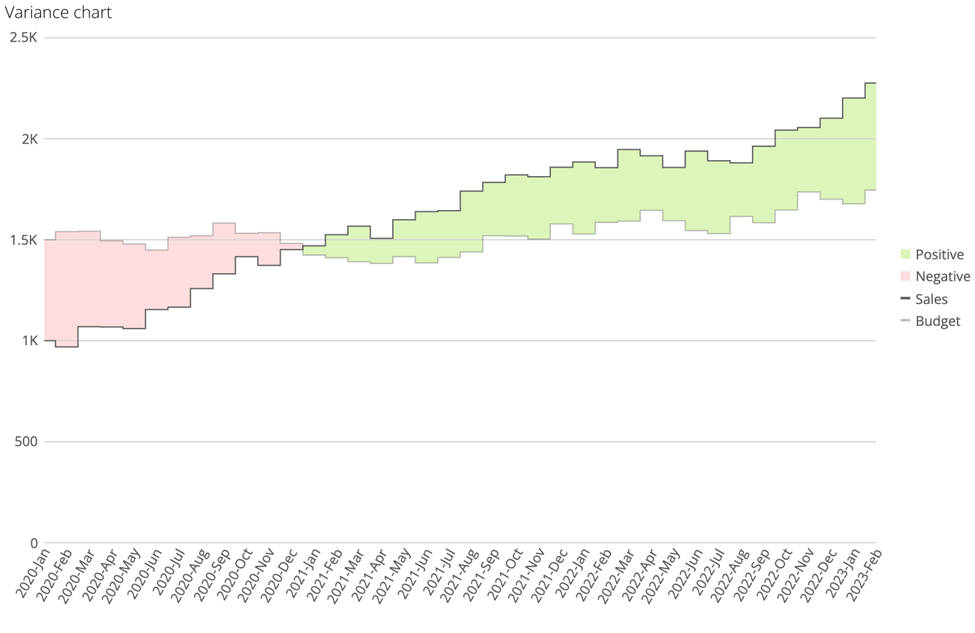
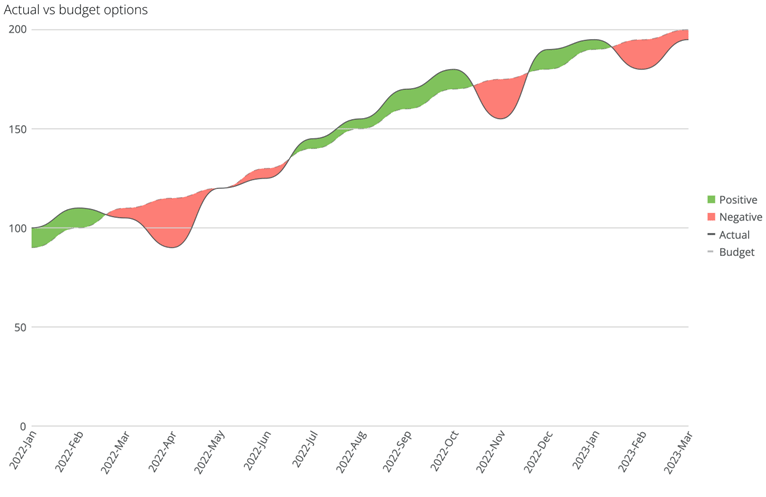
Unlike other chart types that show data directly, variance charts show the differences between two sets of data, such as actual versus budget or actual versus forecast.

Below are two charts. The first shows sales versus budget data as a simple two-line chart, while the second shows the same data as a variance chart. Notice that the variance chart highlights the delta, or difference, data. This is useful when you want to analyze differences between lines.

<Frame>
  <img alt="image.png" src="https://mintcdn.com/domoinc-openapi-sync-dataflows/GXvfa618wDUsB9JU/images/kb/ka05w000001277K-00N5w00000Ri7BU-0EM5w000006u8hO.jpg?fit=max&auto=format&n=GXvfa618wDUsB9JU&q=85&s=e127f03148ebcafb010af1caa2a84343" width="975" height="633" data-path="images/kb/ka05w000001277K-00N5w00000Ri7BU-0EM5w000006u8hO.jpg" />
</Frame>

<Frame>
  <img alt="image.png" src="https://mintcdn.com/domoinc-openapi-sync-dataflows/GXvfa618wDUsB9JU/images/kb/ka05w000001277K-00N5w00000Ri7BU-0EM5w000006u8hx.jpg?fit=max&auto=format&n=GXvfa618wDUsB9JU&q=85&s=905100c5954f0b8bd204a386463ad2be" width="975" height="633" data-path="images/kb/ka05w000001277K-00N5w00000Ri7BU-0EM5w000006u8hx.jpg" />
</Frame>

## Powering Variance Charts

A variance chart requires a `Date` field and an `Actual` value. Although not required, a `Target` value is key to emphasizing the power of the chart. For information about value, category, and series data, see our article about [Understanding Chart Data](https://domo-support.domo.com/s/article/360043428693?language=en_US).

In Analyzer, you can choose the columns containing the data for your variance chart. For more information about choosing data columns, see our article about [Applying DataSet Columns to Your Chart](https://domo-support.domo.com/s/article/360043428713?language=en_US).

The following image shows how data from a typical column-based spreadsheet is converted into a variance chart:
<Frame>
  <img alt="image.png" src="https://mintcdn.com/domoinc-openapi-sync-dataflows/GXvfa618wDUsB9JU/images/kb/ka05w000001277K-00N5w00000Ri7BU-0EM5w000006u8j0.jpg?fit=max&auto=format&n=GXvfa618wDUsB9JU&q=85&s=9a885bc4ab8a320a21eba12b29880be3" width="766" height="497" data-path="images/kb/ka05w000001277K-00N5w00000Ri7BU-0EM5w000006u8j0.jpg" />
</Frame>

## Customizing Variance Charts

You can customize the appearance of a variance chart in several ways, many of which are possible with the **Chart Properties** tool. For more information, see our article about [Chart Properties](https://domo-support.domo.com/s/article/360042925374?language=en_US).

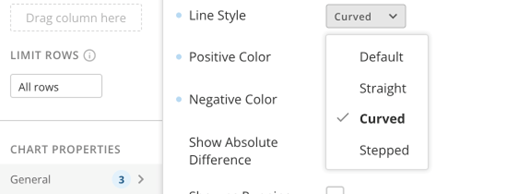
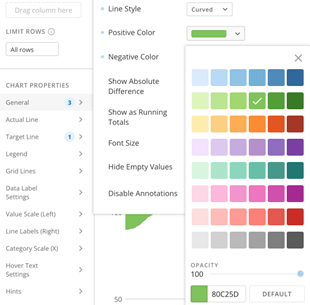
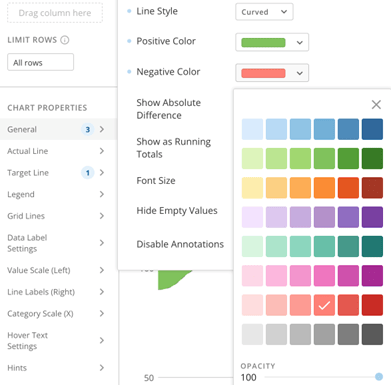
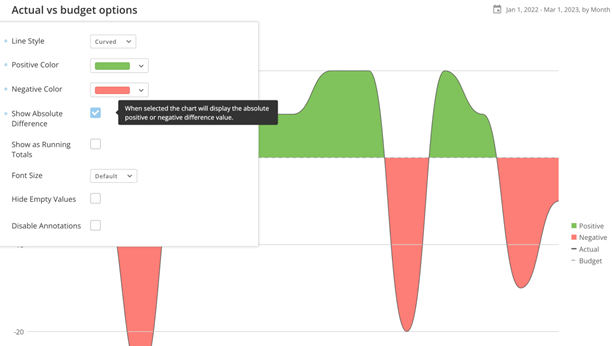
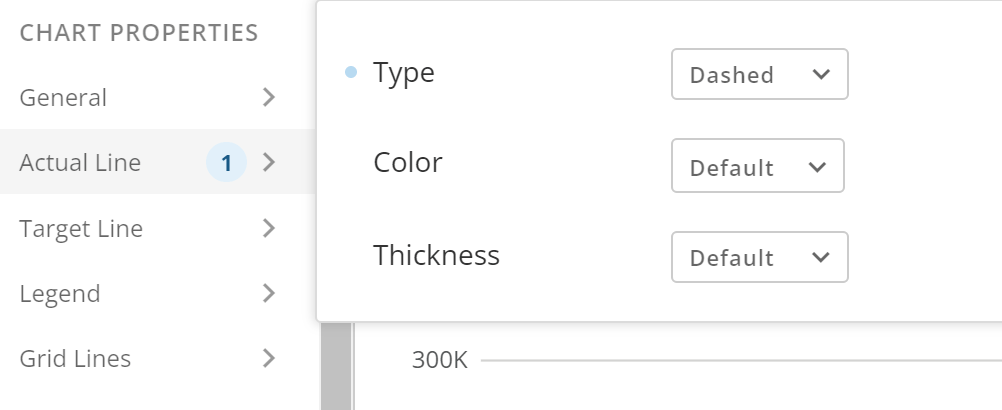
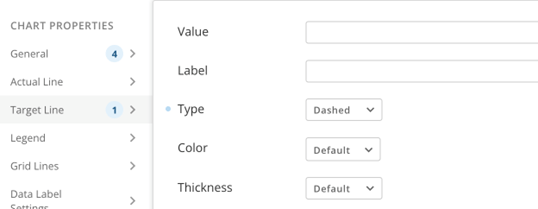
Some unique properties of variance charts are shown in the following table:

<table border="1" cellpadding="1" cellspacing="1" data-aura-rendered-by="33:209;a"><thead><tr><th colspan="1" rowspan="1"><p> Property </p></th><th colspan="1" rowspan="1"><p> Description </p></th><th colspan="1" rowspan="1"><p> Example </p></th></tr></thead><tbody><tr><td colspan="1" rowspan="1"><p> General > Value Format </p></td><td colspan="1" rowspan="1"><p> Determines whether currency symbols are appended to values. </p></td><td colspan="1" rowspan="1"><p> — </p></td></tr><tr><td colspan="1" rowspan="1"><p> General > Value Decimal Places </p></td><td colspan="1" rowspan="1"><p> Determines the number of decimal places in values. </p></td><td colspan="1" rowspan="1"><p> — </p></td></tr><tr><td colspan="1" rowspan="1"><p> General > Percent Value Decimal Places </p></td><td colspan="1" rowspan="1"><p> Determines the number of decimal places in percent values. </p></td><td colspan="1" rowspan="1"><p> — </p></td></tr><tr><td colspan="1" rowspan="1"><p> General > Line Style </p></td><td colspan="1" rowspan="1"><p> Allows you to select a default, straight, curved, or steeped line style between points. You can see which one looks best for your data. </p></td><td colspan="1" rowspan="1"><p><img alt="image.png" src="https://mintcdn.com/domoinc-openapi-sync-dataflows/GXvfa618wDUsB9JU/images/kb/ka05w000001277K-00N5w00000Ri7BU-0EM5w000006u8jU.jpg?fit=max&auto=format&n=GXvfa618wDUsB9JU&q=85&s=2358c7624e1cf82fb5a9a43023062af1" width="507" height="194" data-path="images/kb/ka05w000001277K-00N5w00000Ri7BU-0EM5w000006u8jU.jpg" /></p></td></tr><tr><td colspan="1" rowspan="1"><p> General > Positive Color </p></td><td colspan="1" rowspan="1"><p> Allows you to select the color displayed when the variance is positive. </p></td><td colspan="1" rowspan="1"><p><img alt="image.png" src="https://mintcdn.com/domoinc-openapi-sync-dataflows/GXvfa618wDUsB9JU/images/kb/ka05w000001277K-00N5w00000Ri7BU-0EM5w000006u8jZ.jpg?fit=max&auto=format&n=GXvfa618wDUsB9JU&q=85&s=360ab15a78bb19f7424262d6ad0356eb" width="310" height="305" data-path="images/kb/ka05w000001277K-00N5w00000Ri7BU-0EM5w000006u8jZ.jpg" /></p></td></tr><tr><td colspan="1" rowspan="1"><p> General > Negative Color </p></td><td colspan="1" rowspan="1"><p> Allows you to select the color displayed when the variance is negative. </p></td><td colspan="1" rowspan="1"><p><img alt="image.png" src="https://mintcdn.com/domoinc-openapi-sync-dataflows/GXvfa618wDUsB9JU/images/kb/ka05w000001277K-00N5w00000Ri7BU-0EM5w000006u8je.jpg?fit=max&auto=format&n=GXvfa618wDUsB9JU&q=85&s=409e9642f5ebfc5fc17c0ba1e04d486e" width="391" height="385" data-path="images/kb/ka05w000001277K-00N5w00000Ri7BU-0EM5w000006u8je.jpg" /></p></td></tr></tbody><tbody><tr><td colspan="1" rowspan="1"><p> General > Show Absolute Difference </p></td><td colspan="1" rowspan="1"><p> Displays the values as absolute differences relative to zero. This better visualizes the size or scope of the differences. </p></td><td colspan="1" rowspan="1"><p><img alt="image.png" src="https://mintcdn.com/domoinc-openapi-sync-dataflows/GXvfa618wDUsB9JU/images/kb/ka05w000001277K-00N5w00000Ri7BU-0EM5w000006u8kh.jpg?fit=max&auto=format&n=GXvfa618wDUsB9JU&q=85&s=3fe9f8cc75809569390624491f98e4d4" width="612" height="346" data-path="images/kb/ka05w000001277K-00N5w00000Ri7BU-0EM5w000006u8kh.jpg" /></p></td></tr></tbody><tbody><tr><td colspan="1" rowspan="1"><p> Actual Line </p></td><td colspan="1" rowspan="1"><p> Allows you to set the type, color, and thickness of the actual line. </p></td><td colspan="1" rowspan="1"><p><img alt="image.png" src="https://mintcdn.com/domoinc-openapi-sync-dataflows/GXvfa618wDUsB9JU/images/kb/ka05w000001277K-00N5w00000Ri7BU-0EM5w000006uAdO.jpg?fit=max&auto=format&n=GXvfa618wDUsB9JU&q=85&s=4757ba650fde357f122c70b83b23b599" width="1002" height="410" data-path="images/kb/ka05w000001277K-00N5w00000Ri7BU-0EM5w000006uAdO.jpg" /></p></td></tr></tbody><tbody><tr><td colspan="1" rowspan="1"><p> Target Line </p></td><td colspan="1" rowspan="1"><p> Allows you to set the value, label, type, color, and thickness of the target line. </p></td><td colspan="1" rowspan="1"><img alt="image.png" src="https://mintcdn.com/domoinc-openapi-sync-dataflows/GXvfa618wDUsB9JU/images/kb/ka05w000001277K-00N5w00000Ri7BU-0EM5w000006u8jo.jpg?fit=max&auto=format&n=GXvfa618wDUsB9JU&q=85&s=5ac17154426f7de922e28180821a47d0" width="538" height="209" data-path="images/kb/ka05w000001277K-00N5w00000Ri7BU-0EM5w000006u8jo.jpg" /></td></tr></tbody></table>