> ## Documentation Index
> Fetch the complete documentation index at: https://domoinc-openapi-sync-dataflows.mintlify.site/llms.txt
> Use this file to discover all available pages before exploring further.

# Box Plot Chart

## Intro

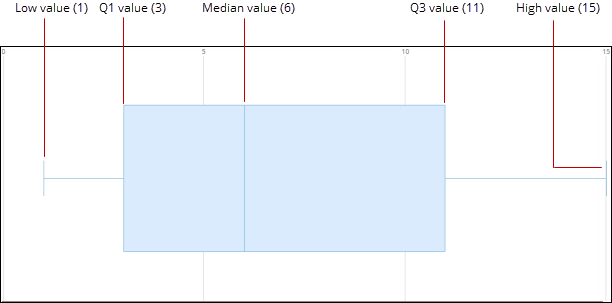
Box plot charts are commonly used to represent statistics and quality measurements. For any given category, at least five values are required in the DataSet. From these values, Domo derives a *high* value, a *Q3* (Quartile 3) value, a *median* value, a *Q1* (Quartile 1) value, and a *low* value. The five derived values for each category are plotted on the chart as a *box and whisker plot*, with the Q1, median, and Q3 values forming the box and the high and low values forming the "whiskers."

As an example, if you uploaded the DataSet *1,3,5,6,9,11,15*, Domo would derive values for an individual box plot diagram as follows:

* The *median* is the middle value in the ordered DataSet, in this case "6."
* The *Q1* and *Q3* values are the medians of the lower and upper halves of the DataSet, in this case "3" and "11."
* The *low* and *high* values are the lowest and highest values in the DataSet, in this case "1" and "15."

The resulting box plot would appear as follows:

<Frame>
  <img alt="boxplot_data.png" src="https://mintcdn.com/domoinc-openapi-sync-dataflows/KRKoASQJgRuO8wHw/images/kb/ka05w00000123pO-00N5w00000Ri7BU-0EM5w000005vPHc.png?fit=max&auto=format&n=KRKoASQJgRuO8wHw&q=85&s=14e35c5b0f420a69ab3a8c7a98fd994c" width="612" height="303" data-path="images/kb/ka05w00000123pO-00N5w00000Ri7BU-0EM5w000005vPHc.png" />
</Frame>

Box plot charts include both vertical and horizontal sub-types.

## Powering box plot charts

Box plot charts require two columns or rows of data from your DataSet—a category column or row containing the name of each individual box-and-whisker diagram, and a value column or row containing the values for each category, from which the box plot values will be derived. For information about value, category, and series data, see [Understanding Chart Data](/s/article/360043428693 "Understanding Chart Data").
<Note>
  **Note:** Box plot charts have a limit of 100,000 rows of data (in contrast to most other chart types, which allow only 25,000 rows).
</Note>

In the Analyzer, you choose the columns containing the data for your box plot chart. For more information about choosing data columns, see [Applying DataSet Columns to Your Chart](/s/article/360043428713 "Applying DataSet Columns to Your Chart").

For more information about formatting charts in the Analyzer, see [Visualization Card Building Part 2: The Analyzer](/s/topic/0TO5w000000ZaoUGAS "KPI Card Building Part 2: The Card Builder").

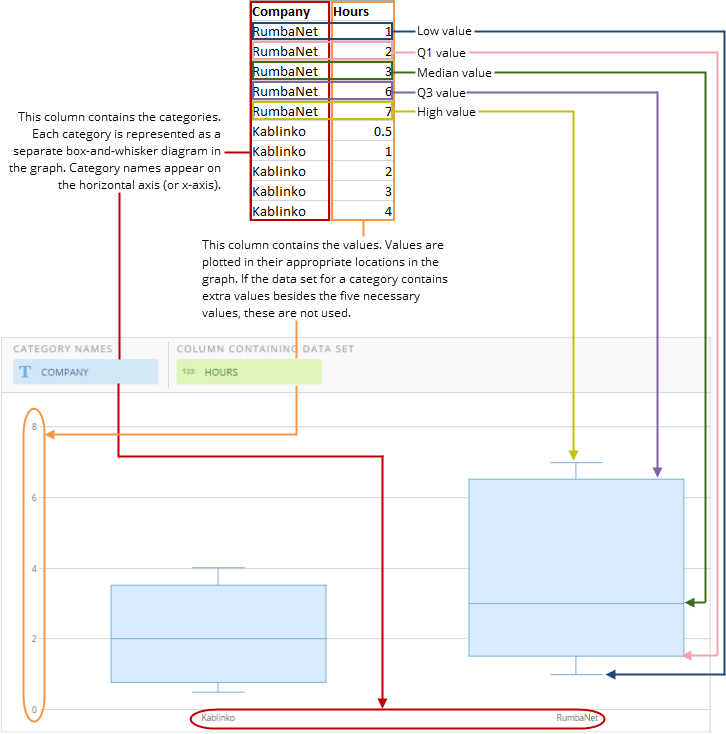
The following graphic shows you how the data from the category and value columns in a typical column-based spreadsheet is converted into a two-diagram box plot chart:

<Frame>
  <img alt="" src="https://mintcdn.com/domoinc-openapi-sync-dataflows/KRKoASQJgRuO8wHw/images/kb/ka05w00000123pO-00N5w00000Ri7BU-0EM5w000005vPHd.png?fit=max&auto=format&n=KRKoASQJgRuO8wHw&q=85&s=78965e06671708f5ebfa2e7c9e7748d3" style={{width: 726, height: 734}} width="726" height="734" data-path="images/kb/ka05w00000123pO-00N5w00000Ri7BU-0EM5w000005vPHd.png" />
</Frame>

## Customizing box plot charts

You can customize the appearance of a box plot chart by editing its **Chart Properties**. For information about all chart properties, see [Chart Properties](/s/topic/0TO5w000000ZaodGAC "Chart Properties"). Unique properties of box plot charts include the following. You can click a thumbnail image to see a larger image.

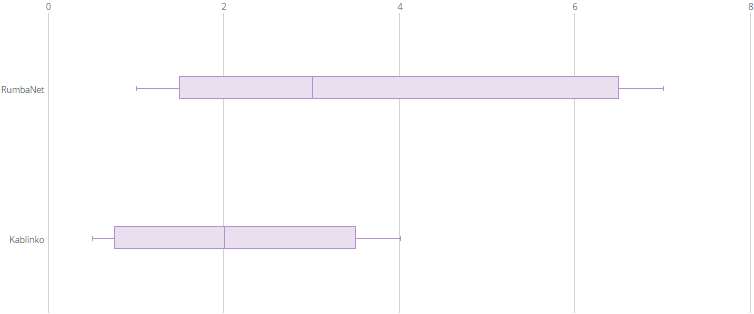
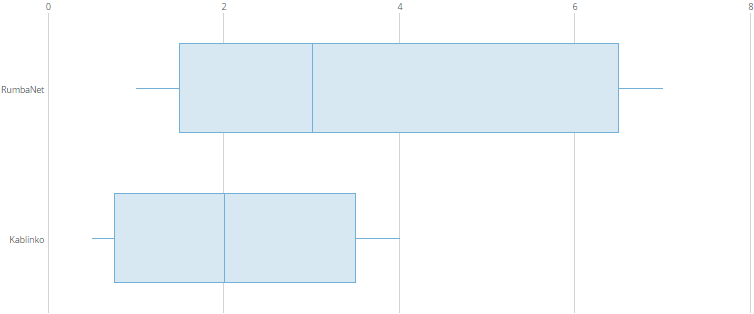
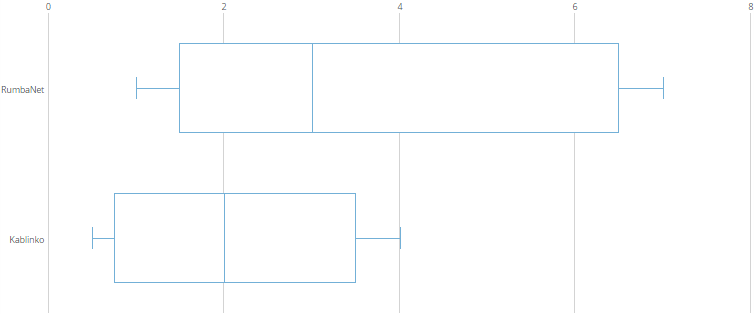
<table border="1" cellpadding="1" cellspacing="1" data-aura-rendered-by="33:209;a"><thead><tr><th colspan="1" rowspan="1"><p> Property </p></th><th colspan="1" rowspan="1"><p> Description </p></th><th colspan="1" rowspan="1"><p> Example </p></th></tr></thead><tbody><tr><td colspan="1" rowspan="1"><p> General > Line Color </p></td><td colspan="1" rowspan="1"><p> Determines the color of lines in a box plot. If the <b> Disable Fill </b> property is unchecked, the fill color of the boxes matches the line color; otherwise only the lines are colored. The default color is blue. </p></td><td colspan="1" rowspan="1"> — </td></tr><tr><td colspan="1" rowspan="1"><p> General > Percent Width </p></td><td colspan="1" rowspan="1"><p> Determines the width of box plot diagrams in the chart. You can enter any value between 10 and 100. The lower the value, the thinner the boxes. In the example, the <b> Percent Width </b> has been set to <span class="mt-font-courier-new"> 15 </span>. </p></td><td colspan="1" rowspan="1"><img alt="boxplot_percent_width.png" src="https://mintcdn.com/domoinc-openapi-sync-dataflows/KRKoASQJgRuO8wHw/images/kb/ka05w00000123pO-00N5w00000Ri7BU-0EM5w000005vPHb.png?fit=max&auto=format&n=KRKoASQJgRuO8wHw&q=85&s=fad9d4fb052e5e45b97a5c087f0a1dce" width="754" height="314" data-path="images/kb/ka05w00000123pO-00N5w00000Ri7BU-0EM5w000005vPHb.png" /></td></tr><tr><td colspan="1" rowspan="1"><p> General > Hide Whisker Caps </p></td><td colspan="1" rowspan="1"><p> When enabled, hides the "whisker caps," the lines for high and low values that appear at the ends of the "whisker lines" by default. In the example, whisker caps have been hidden. </p></td><td colspan="1" rowspan="1"><img alt="whisker_caps_off.png" src="https://mintcdn.com/domoinc-openapi-sync-dataflows/KRKoASQJgRuO8wHw/images/kb/ka05w00000123pO-00N5w00000Ri7BU-0EM5w000005vPHa.png?fit=max&auto=format&n=KRKoASQJgRuO8wHw&q=85&s=8f433b4c0702c12ad437d725581c71ed" width="754" height="314" data-path="images/kb/ka05w00000123pO-00N5w00000Ri7BU-0EM5w000005vPHa.png" /></td></tr><tr><td colspan="1" rowspan="1"><p> General > Disable Fill </p></td><td colspan="1" rowspan="1"><p> By default, boxes in a box plot chart contain a colored fill. Checking this box removes the fill, causing the boxes to appear transparent, as in the example. </p></td><td colspan="1" rowspan="1"><img alt="boxplot_fill_disabled.png" src="https://mintcdn.com/domoinc-openapi-sync-dataflows/KRKoASQJgRuO8wHw/images/kb/ka05w00000123pO-00N5w00000Ri7BU-0EM5w000005vPHf.png?fit=max&auto=format&n=KRKoASQJgRuO8wHw&q=85&s=e7f370402afc4ba9ddd9d9e5286ffd8b" width="754" height="314" data-path="images/kb/ka05w00000123pO-00N5w00000Ri7BU-0EM5w000005vPHf.png" /></td></tr></tbody></table>