> ## Documentation Index
> Fetch the complete documentation index at: https://domoinc-openapi-sync-dataflows.mintlify.site/llms.txt
> Use this file to discover all available pages before exploring further.
# Editing the Column Header Labels for Your Chart Table View
export const InlineImage = ({src, alt = '', height = '1.6em'}) => {
return  ;
};
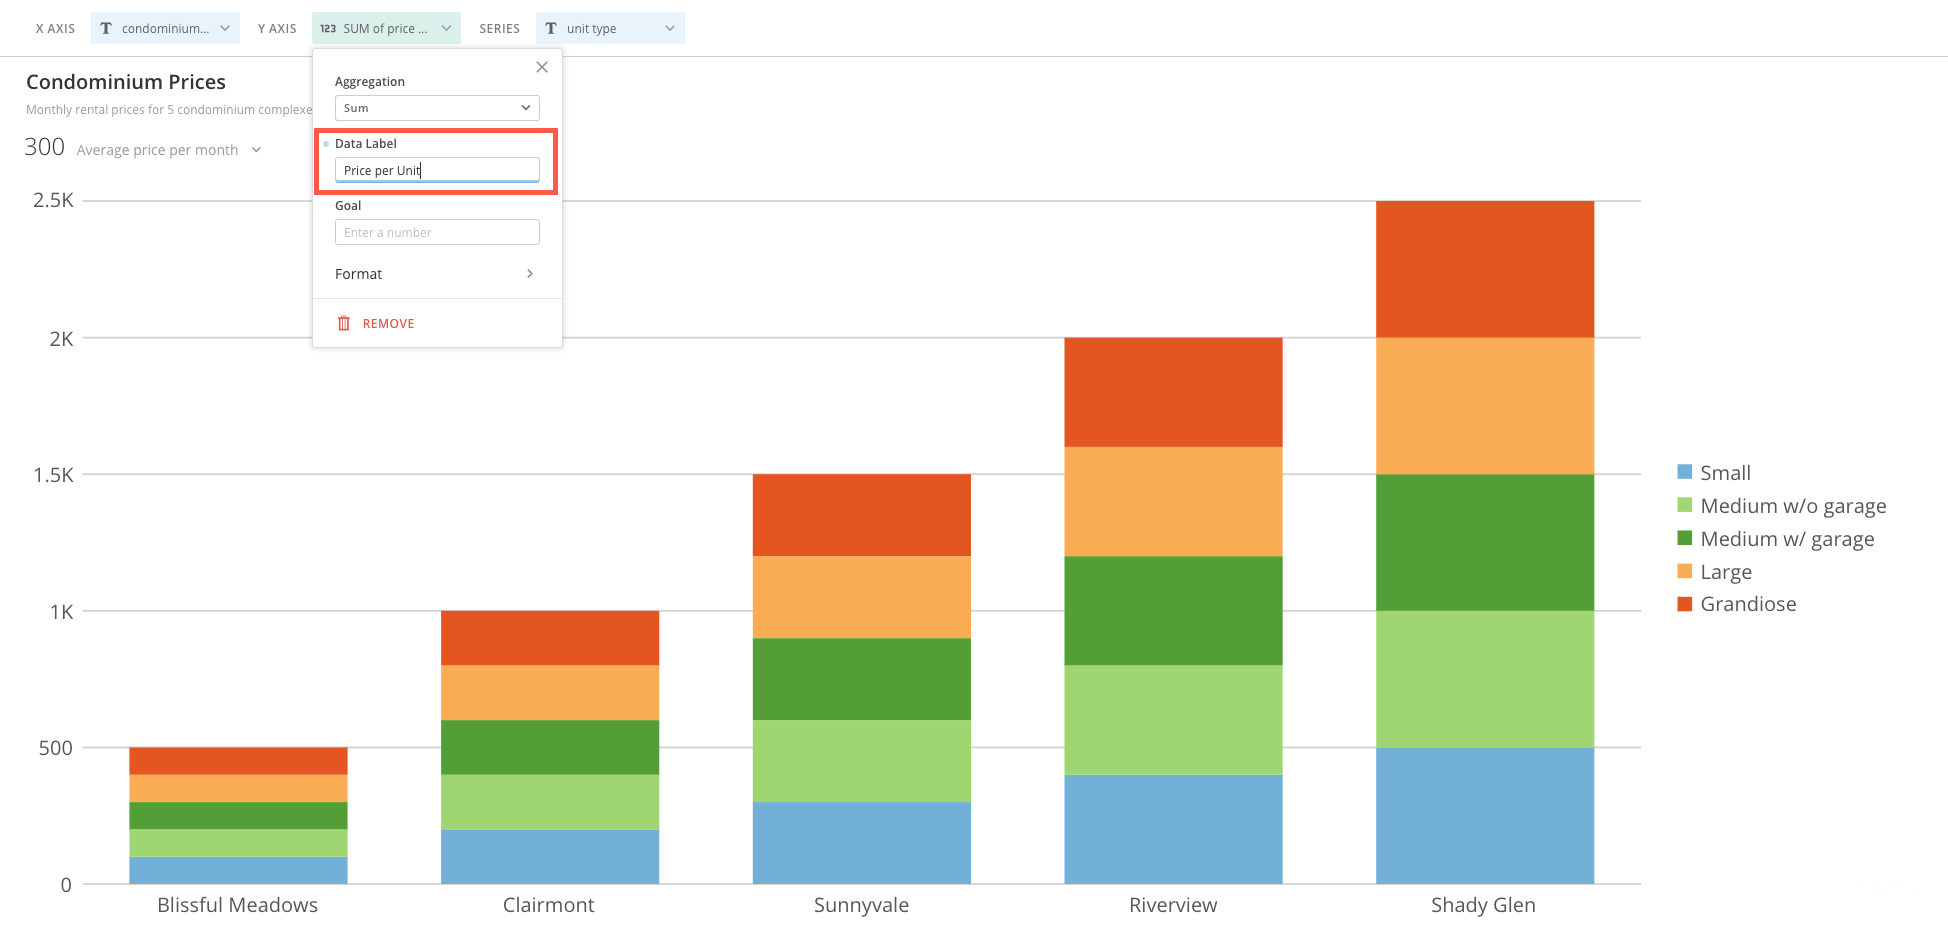
By default the column header labels in the Details **Table** view for your chart are the same as those in your original DataSet. However, in the Analyzer, you can change these. You do this by entering a new label in the **Label** field for the desired column. This field is hidden by default but you can open it by clicking the column name you want to change in the column fields area above the chart.
;
};
By default the column header labels in the Details **Table** view for your chart are the same as those in your original DataSet. However, in the Analyzer, you can change these. You do this by entering a new label in the **Label** field for the desired column. This field is hidden by default but you can open it by clicking the column name you want to change in the column fields area above the chart.
 When you specify a label, it appears above its associated column in the **Table** view in the Details page, as shown in the following screenshot:
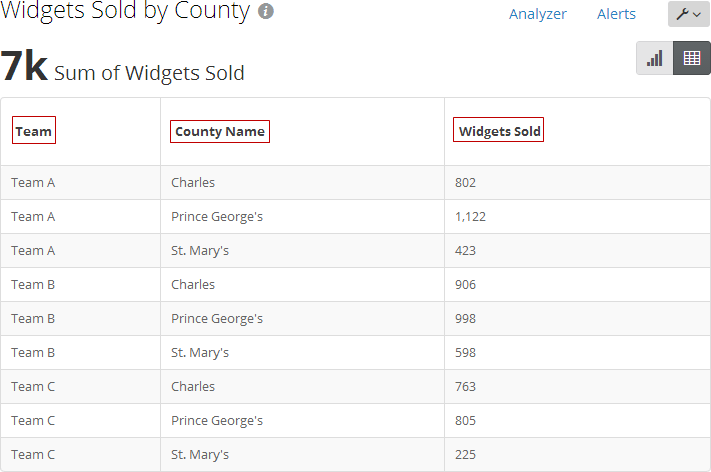 For example, if your DataSet contained a values column named "SLS1014" and you wanted to give it a more comprehensible name for your viewers such as "Sales for October 2014," you would open the Analyzer, click the "SLS1014" column name in the field area, then enter "Sales for October 2014" into the **Label** field. Viewers who went into the Details page and then clicked to open the **Table** view would see the new label in the data table.
For more information about the Analyzer layout, see [Table view](/s/article/360042923934 "Card Builder Layout").
**To add a Table view label,**
1. In the Analyzer for the chart, click the column name you want to change in the field area above the chart.
2. Enter the desired label in the **Label** field.
3. Press Enter.
For example, if your DataSet contained a values column named "SLS1014" and you wanted to give it a more comprehensible name for your viewers such as "Sales for October 2014," you would open the Analyzer, click the "SLS1014" column name in the field area, then enter "Sales for October 2014" into the **Label** field. Viewers who went into the Details page and then clicked to open the **Table** view would see the new label in the data table.
For more information about the Analyzer layout, see [Table view](/s/article/360042923934 "Card Builder Layout").
**To add a Table view label,**
1. In the Analyzer for the chart, click the column name you want to change in the field area above the chart.
2. Enter the desired label in the **Label** field.
3. Press Enter.