> ## Documentation Index
> Fetch the complete documentation index at: https://domoinc-openapi-sync-dataflows.mintlify.site/llms.txt
> Use this file to discover all available pages before exploring further.

# Comparative Gauge

### Intro

A Comparative gauge is a simplified version of a [Comparative Fill gauge](/s/article/360042924414). Like a Comparative Fill gauge, a Comparative gauge shows the degree of change between a previous value and a current value. However, Comparative gauges lack graphical elements and consist solely of a percentage value. They do not require minimum, maximum, or target values.

The degree of change may be shown as a percentage or as a straight value. Alternatively, you may choose to show only the current value. You can change this setting in the chart properties.

Learn more about [other gauges](/s/article/360042924334) in Domo.

***

## Power a Comparative Gauge

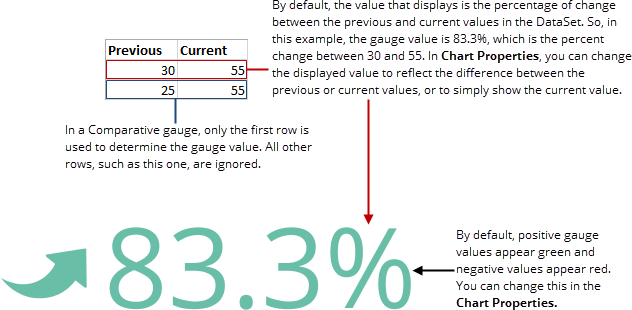
A Comparative gauge requires only two columns or rows of data from your DataSet. One of these contains the current value for the gauge, and the other contains the previous value.

If multiple rows are present in your DataSet, only the *first* row is used. No aggregations occur.

In Analyzer, you choose the columns containing the data for your Comparative gauge. For more information about choosing data columns, see [Applying DataSet Columns to Your Chart](/s/article/360043428713 "Applying DataSet Columns to Your Chart").

The following graphic shows you how the data from the previous and current value columns in a typical column-based spreadsheet is converted into a comparative gauge:

<Frame>
  <img alt="comparative_gauge_spreadsheet_example.png" src="https://mintcdn.com/domoinc-openapi-sync-dataflows/J3x-O8qWbl7BB1F9/images/kb/ka0Vq000000E8k5-00N5w00000Ri7BU-0EM5w000005vPAw.png?fit=max&auto=format&n=J3x-O8qWbl7BB1F9&q=85&s=c2defd5355bbeb6c7b29d9112efac823" width="632" height="310" data-path="images/kb/ka0Vq000000E8k5-00N5w00000Ri7BU-0EM5w000005vPAw.png" />
</Frame>

## Unique Properties — Comparative Gauge

You can customize the appearance of a comparative gauge by editing its chart properties. This table describes the properties unique to Comparative gauges. For information about other available properties, see [Properties for Gauges](/s/article/360042925354 "Chart Properties").

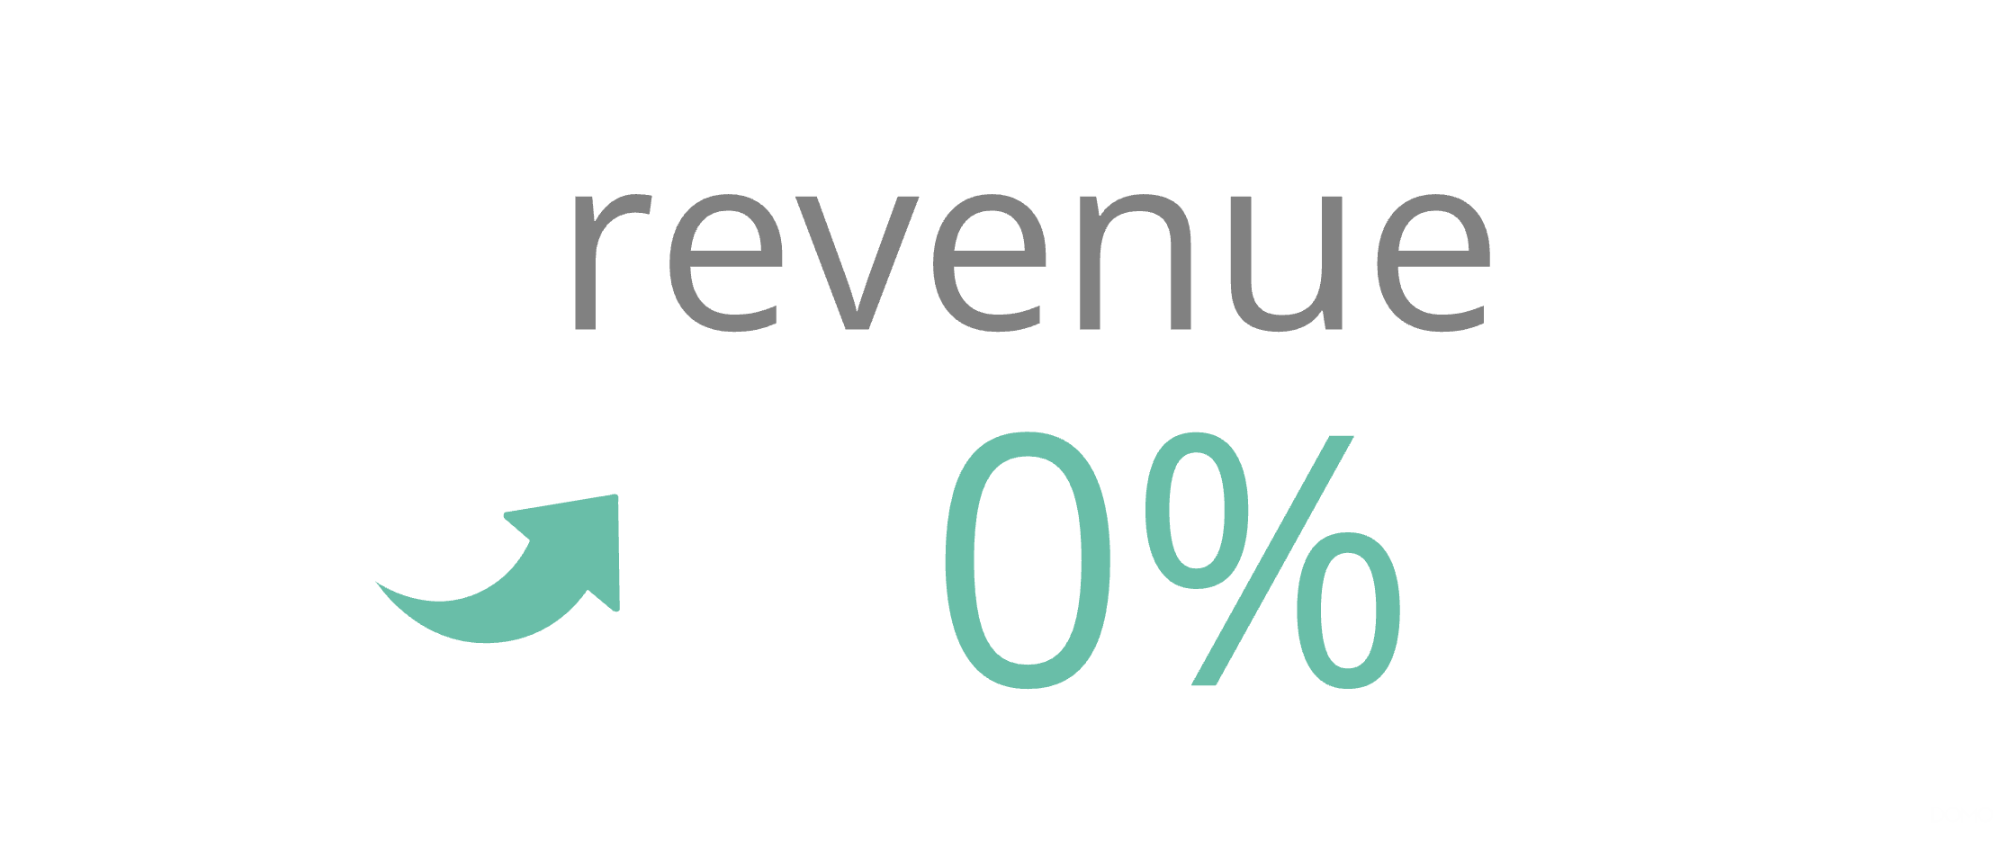
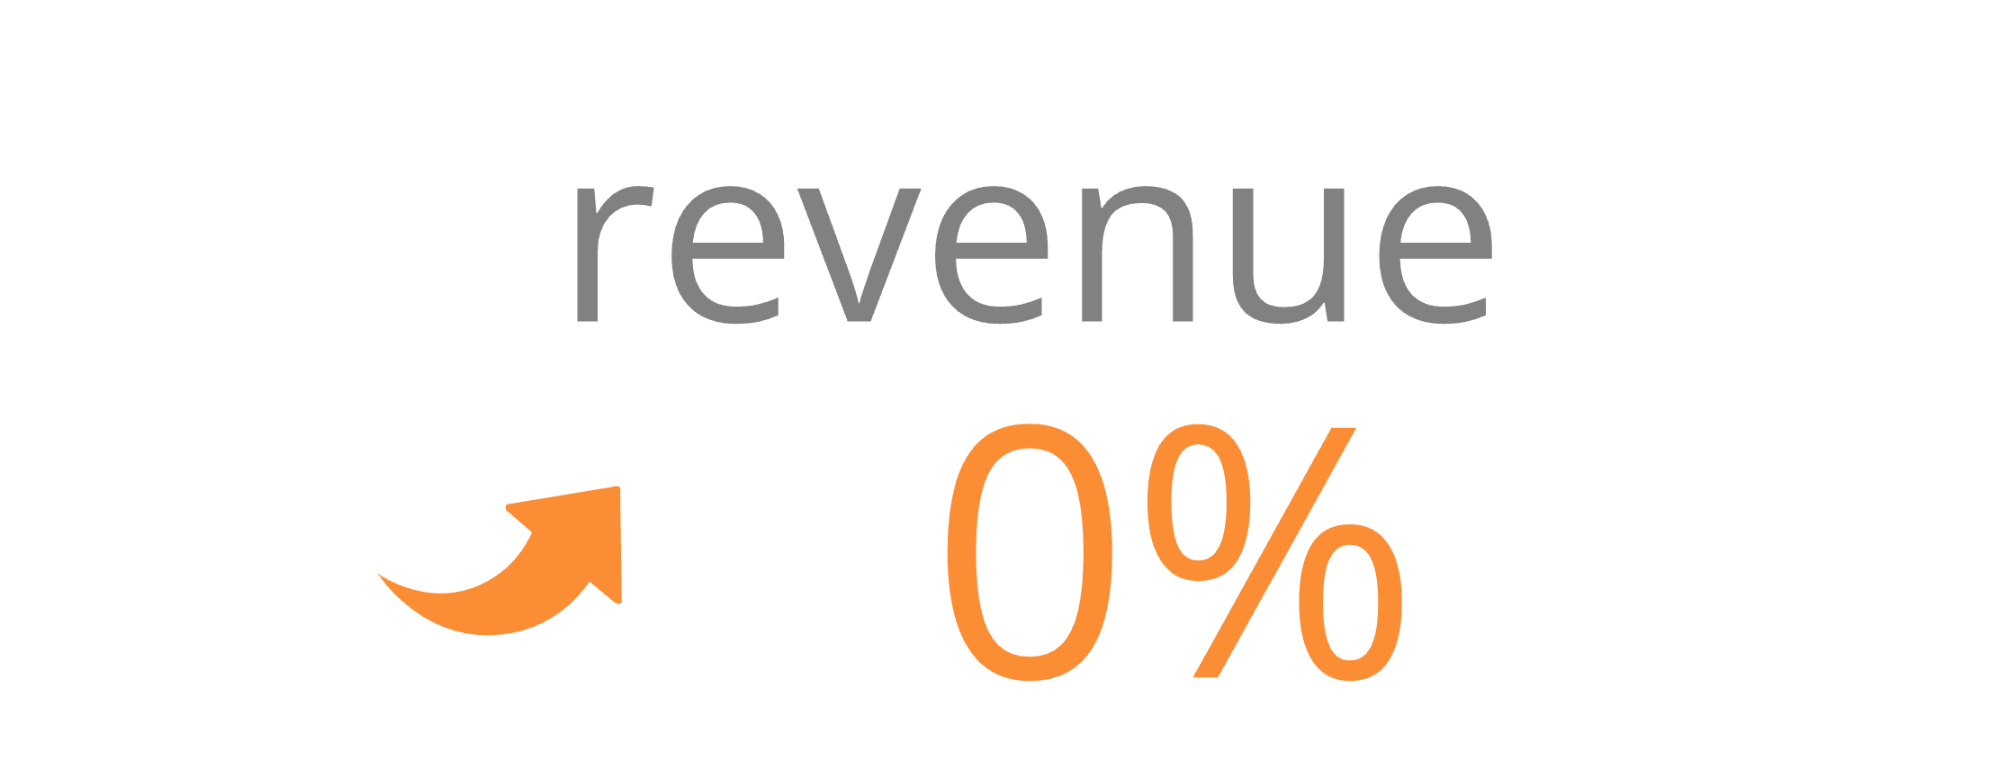
<table border="1" cellpadding="1" cellspacing="1" data-aura-rendered-by="33:202;a"><thead><tr><th colspan="1" rowspan="1"><p> Property </p></th><th colspan="1" rowspan="1"><p> Description </p></th><th colspan="1" rowspan="1"><p><b> Example </b></p></th></tr></thead><tbody><tr><td colspan="1" rowspan="1"><p><b> General </b> > <b> Value displayed </b></p></td><td colspan="1" rowspan="1"><p> Determines whether the displayed value is the percent of change between the previous and current value (default), the actual change in value, or the current value. </p><p> For example, the previous value in your DataSet was 30 and the current value was 55. </p><ul><li> If you select <b> Percentage Change </b> the gauge displays "83.3%," which is the percentage of change between 30 and 55. Make sure that the <b> General </b> > <b> Value Format </b> property is set to <b> Percentage </b>. See <a href="/s/article/360042925354" target="_self"> Properties for Gauges </a> to learn about the <b> General </b> > <b> Value format </b> property. </li><li> If you select <b> Value Change </b>, the gauge displays "25," which is the actual difference between the two values. </li><li> If you select <b> Value Change </b> or <b> Current Value </b> for this property, make sure that the <b> General </b> > <b> Value Format </b> property is set to <b> Number </b>; otherwise, your gauge value will have an unnecessary percent symbol. See <a href="/s/article/360042925354" target="_self"> Properties for Gauges </a> to learn about the <b> General </b> > <b> Value format </b> property. </li></ul></td><td colspan="1" rowspan="1"><p> — </p></td></tr><tr><td colspan="1" rowspan="1"><p><b> General </b> > <b> Show label </b></p></td><td colspan="1" rowspan="1"><p> When enabled, a label displays above the value. </p></td><td colspan="1" rowspan="1"><p><img alt="" src="https://mintcdn.com/domoinc-openapi-sync-dataflows/J3x-O8qWbl7BB1F9/images/kb/ka0Vq000000E8k5-00N5w00000Ri7BU-0EMVq000007tIZl.jpg?fit=max&auto=format&n=J3x-O8qWbl7BB1F9&q=85&s=263b2ae72d772c68db1bc4c549dabcef" style={{width: 404, height: 173}} width="2014" height="864" data-path="images/kb/ka0Vq000000E8k5-00N5w00000Ri7BU-0EMVq000007tIZl.jpg" /></p></td></tr><tr><td colspan="1" rowspan="1"><p><b> General </b> > <b> Override color </b></p></td><td colspan="1" rowspan="1"><p> Allows you to select a color for the gauge. If you choose a color for this property, it overrides any color selections for positive or negative values. </p></td><td colspan="1" rowspan="1"><p><img alt="" src="https://mintcdn.com/domoinc-openapi-sync-dataflows/J3x-O8qWbl7BB1F9/images/kb/ka0Vq000000E8k5-00N5w00000Ri7BU-0EMVq000007tIzZ.jpg?fit=max&auto=format&n=J3x-O8qWbl7BB1F9&q=85&s=5aa88c1cde023ca9edd6058da20c4c59" style={{width: 402, height: 156}} width="2013" height="781" data-path="images/kb/ka0Vq000000E8k5-00N5w00000Ri7BU-0EMVq000007tIzZ.jpg" /></p></td></tr></tbody></table>