> ## Documentation Index
> Fetch the complete documentation index at: https://domoinc-openapi-sync-dataflows.mintlify.site/llms.txt
> Use this file to discover all available pages before exploring further.

# Face Gauge

### Intro

A gauge is a simple chart that indicates progress towards meeting a target. A face gauge uses an image of a face to show progress towards a goal. Three ranges are available—a red frowning face for "poor," an orange face with a blank expression for "fair," and a green smiling face for "excellent."

Learn about [other gauges](/s/article/360042924334) in Domo.

***

### Power a Face Gauge

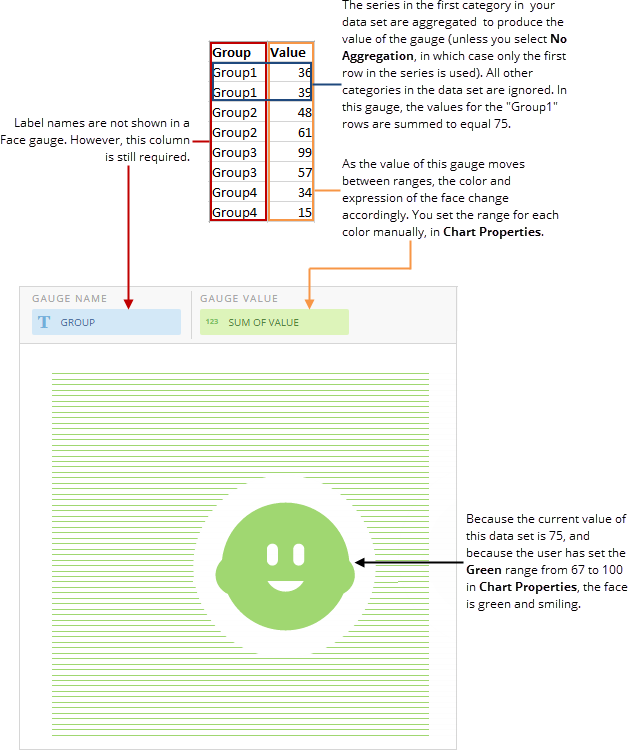
A Face Gauge requires only two columns or rows of data from your DataSet—one contains categories, and the other contains the values. If multiple categories are present, only the first category is used; all the others are ignored. If the first category contains more than one series, the series are aggregated to yield a single value for the gauge unless you select **No Aggregation**. Only three ranges are available in face gauges.

Learn about [properties for gauges](/s/article/360042925354). For information about value, category, and series data, see [Understanding Chart Data](/s/article/360043428693 "Understanding Chart Data").

In the Analyzer, you choose the columns containing the data for your face gauge. For more information about choosing data columns, see [Applying DataSet Columns to Your Chart](/s/article/360043428713 "Applying DataSet Columns to Your Chart").

The following graphic shows you how the data from the category and value columns in a typical column-based spreadsheet is converted into a face gauge:

<Frame>
  <img alt="" src="https://mintcdn.com/domoinc-openapi-sync-dataflows/7il5zODxajeeXiuu/images/kb/ka0Vq000000DhaD-00N5w00000Ri7BU-0EM5w000005vPAK.png?fit=max&auto=format&n=7il5zODxajeeXiuu&q=85&s=cb95e34bc18451333f64a0d43300a7d1" style={{width: 600, height: 717}} width="628" height="750" data-path="images/kb/ka0Vq000000DhaD-00N5w00000Ri7BU-0EM5w000005vPAK.png" />
</Frame>

## Unique Properties — Face Gauge

You can customize the appearance of a gauge by editing its chart properties in Analyzer.

<Warning>
  **Important:** This list describes the properties that are unique to Face Gauges. To see descriptions of the properties Face Gauges share with other gauges, see [Properties for Gauges](/s/article/360042925354).
</Warning>

<table border="1" cellpadding="1" cellspacing="1" data-aura-rendered-by="33:209;a"><thead><tr><th colspan="1" rowspan="1"><p> Property </p></th><th colspan="1" rowspan="1"><p> Description </p></th><th colspan="1" rowspan="1"><p><b> Example </b></p></th></tr></thead><tbody><tr><td colspan="1" rowspan="1"><p><b> General </b> > <b> Hide lines </b></p></td><td colspan="1" rowspan="1"><p> Hides the horizontal lines in the gauge, leaving only the face. </p></td><td colspan="1" rowspan="1"><p><img alt="" src="https://mintcdn.com/domoinc-openapi-sync-dataflows/7il5zODxajeeXiuu/images/kb/ka0Vq000000DhaD-00N5w00000Ri7BU-0EMVq000007f9mU.jpg?fit=max&auto=format&n=7il5zODxajeeXiuu&q=85&s=fc506a9209c3e51bca7347765521e93b" style={{width: 300, height: 290}} width="752" height="726" data-path="images/kb/ka0Vq000000DhaD-00N5w00000Ri7BU-0EMVq000007f9mU.jpg" /></p></td></tr><tr><td colspan="1" rowspan="1"><p><b> General </b> > <b> Use all space </b></p></td><td colspan="1" rowspan="1"><p> Scales the face to use all available space. </p></td><td colspan="1" rowspan="1"><p><img alt="" src="https://mintcdn.com/domoinc-openapi-sync-dataflows/7il5zODxajeeXiuu/images/kb/ka0Vq000000DhaD-00N5w00000Ri7BU-0EMVq000007fD25.jpg?fit=max&auto=format&n=7il5zODxajeeXiuu&q=85&s=aaab453600f4911cffa8249c589fd68d" style={{width: 450, height: 340}} width="1548" height="1170" data-path="images/kb/ka0Vq000000DhaD-00N5w00000Ri7BU-0EMVq000007fD25.jpg" /></p></td></tr><tr><td colspan="1" rowspan="1"><p><b> Green Range/Yellow Range/Red Range </b> > <b> Minimum value </b></p></td><td colspan="1" rowspan="1"><p> Lets you specify the minimum value for the selected color range. </p></td><td colspan="1" rowspan="1"><p> — </p></td></tr><tr><td colspan="1" rowspan="1"><p><b> Green Range/Yellow Range/Red Range > Maximum value </b></p></td><td colspan="1" rowspan="1"><p> Lets you specify the maximum value for the selected color range. </p></td><td colspan="1" rowspan="1"><p> — </p></td></tr></tbody></table>