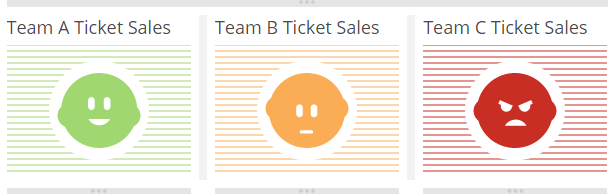
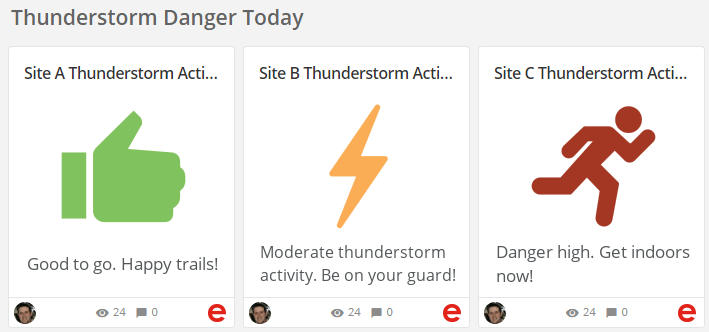
 In addition to faces, all of the following shapes are available for you to use in shape gauges, and many more.
* Geometric shapes like squares, circles, triangles, pentagons, and octagons
* Thumbs up/down
* Airplanes taking off/landing
* Lightning bolts
* Batteries full/empty
You can customize the color of any shape, and have up to 10 ranges in a Shape Gauge.
In addition to faces, all of the following shapes are available for you to use in shape gauges, and many more.
* Geometric shapes like squares, circles, triangles, pentagons, and octagons
* Thumbs up/down
* Airplanes taking off/landing
* Lightning bolts
* Batteries full/empty
You can customize the color of any shape, and have up to 10 ranges in a Shape Gauge.
 Learn more about [other gauges](/s/article/360042924334) in Domo.
***
* Power a Shape Gauge
* Unique properties — Shape Gauges
***
### Power a Shape Gauge
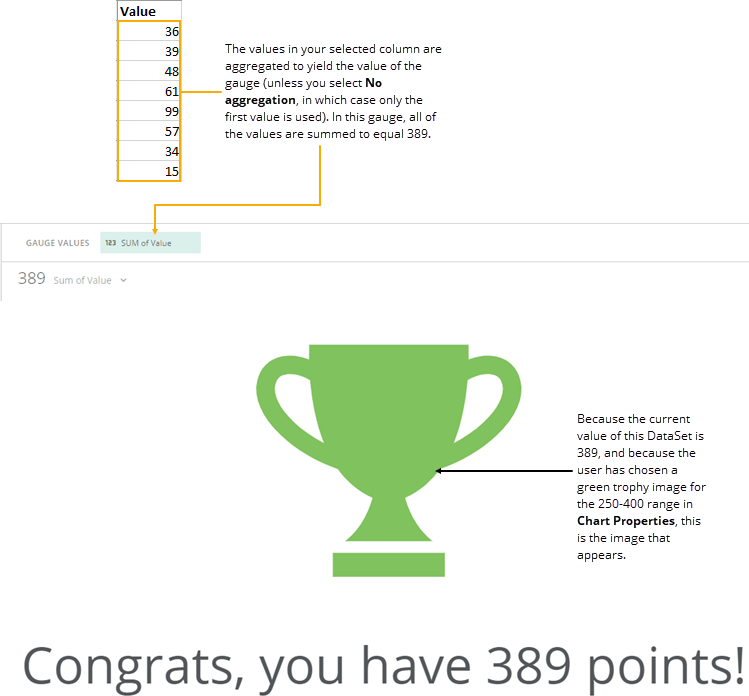
A Shape Gauge requires only one column or row of data from your DataSet, which should contain value data. The value data is aggregated based on what you select in the **Calculation** menu (which you access by selecting the column name next to "Gauge Values"). For example, if you select **Sum**, the values in the column are summed, and this total value is used for the gauge. If you select **No aggregation**, the first value in the DataSet is used. Learn more about [Understanding Chart Data](/s/article/360043428693 "Understanding Chart Data") and [Applying DataSet Columns to Your Chart](/s/article/360043428713 "Applying DataSet Columns to Your Chart").
The following graphic shows you how the data from the category and value columns in a typical column-based spreadsheet is converted into a Shape Gauge:
Learn more about [other gauges](/s/article/360042924334) in Domo.
***
* Power a Shape Gauge
* Unique properties — Shape Gauges
***
### Power a Shape Gauge
A Shape Gauge requires only one column or row of data from your DataSet, which should contain value data. The value data is aggregated based on what you select in the **Calculation** menu (which you access by selecting the column name next to "Gauge Values"). For example, if you select **Sum**, the values in the column are summed, and this total value is used for the gauge. If you select **No aggregation**, the first value in the DataSet is used. Learn more about [Understanding Chart Data](/s/article/360043428693 "Understanding Chart Data") and [Applying DataSet Columns to Your Chart](/s/article/360043428713 "Applying DataSet Columns to Your Chart").
The following graphic shows you how the data from the category and value columns in a typical column-based spreadsheet is converted into a Shape Gauge:
 ### Unique Properties — Shape Gauge
You can customize the appearance of a Shape Gauge by editing its chart properties in Analyzer.
### Unique Properties — Shape Gauge
You can customize the appearance of a Shape Gauge by editing its chart properties in Analyzer.
Property | Description |
|---|---|
Range 1-10 > Symbol | Sets the symbol to display for the selected range. |
Range 1-10 > Maximum Value | Lets you specify the maximum value for the selected range. |
Range 1-10 > Color | Lets you specify the color for the selected range. |
Out of Range > Color | Lets you specify the color used when the current value does not fall within any of the ranges you have configured. |
Out of Range > Symbol | Lets you specify the symbol used when the current value does not fall within any of the ranges you have configured. |