 ***
Range Selector Cards are a type of Filter Cards. Learn about the other Filter Card types:
* [Slicer, Checkbox Selector, and Radio Button Selector Cards](/s/article/360043429313 "Slicer, Checkbox, and Radio Button Cards")
* [Date Selector Card](/s/article/360042924474 "Date Selector Card")
***
### Power Range Selector Cards
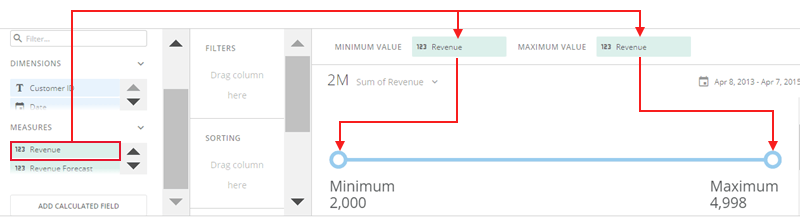
In Analyzer, creating a Range Selector Card requires two columns/rows of data from your DataSet. One column/row contains the minimum value for your slider and the other contains the maximum value.
When you drag a column/row to the **Minimum value** field, the smallest value in the column is used. When you drag a column/row in the **Maximum value** field. the largest value is used.
Both fields can use the same column, but it must be a value or date column.
***
Range Selector Cards are a type of Filter Cards. Learn about the other Filter Card types:
* [Slicer, Checkbox Selector, and Radio Button Selector Cards](/s/article/360043429313 "Slicer, Checkbox, and Radio Button Cards")
* [Date Selector Card](/s/article/360042924474 "Date Selector Card")
***
### Power Range Selector Cards
In Analyzer, creating a Range Selector Card requires two columns/rows of data from your DataSet. One column/row contains the minimum value for your slider and the other contains the maximum value.
When you drag a column/row to the **Minimum value** field, the smallest value in the column is used. When you drag a column/row in the **Maximum value** field. the largest value is used.
Both fields can use the same column, but it must be a value or date column.
 Learn more about choosing data columns in [Applying DataSet Columns to Your Chart](/s/article/360043428713 "Applying DataSet Columns to Your Chart").
Learn how to format charts in Analyzer in our [Analyzer documentation](https://domo-support.domo.com/s/topic/0TO5w000000ZaoUGAS/analyzer?language=en_US "KPI Card Building Part 2: The Card Builder").
### Customize Range Selector Cards
You can customize the appearance of a Range Selector Card by editing its chart properties. Learn about all available [Chart Properties](/s/article/360042925154 "Chart Properties").
This table details the unique properties of Range Selector Cards:
Learn more about choosing data columns in [Applying DataSet Columns to Your Chart](/s/article/360043428713 "Applying DataSet Columns to Your Chart").
Learn how to format charts in Analyzer in our [Analyzer documentation](https://domo-support.domo.com/s/topic/0TO5w000000ZaoUGAS/analyzer?language=en_US "KPI Card Building Part 2: The Card Builder").
### Customize Range Selector Cards
You can customize the appearance of a Range Selector Card by editing its chart properties. Learn about all available [Chart Properties](/s/article/360042925154 "Chart Properties").
This table details the unique properties of Range Selector Cards:
Property
Description
Example
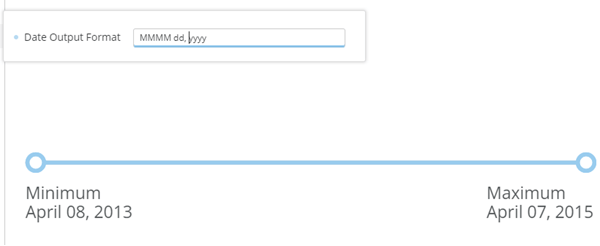
General > Date output format
Lets you change the date format used in your Range Selector card slider if you have applied date columns in your Minimum value and Maximum value fields. For example, if you entered MMMM dd, yyyy in this field, dates would appear in the format shown in the example at right. For a list of macros you can use for formatting dates, see Changing the Date Format in Your Chart .