> ## Documentation Index
> Fetch the complete documentation index at: https://domoinc-openapi-sync-dataflows.mintlify.site/llms.txt
> Use this file to discover all available pages before exploring further.

# Old Magic ETL Tiles: Edit Columns

export const InlineImage = ({src, alt = '', height = '1.6em'}) => {
  return <img noZoom src={src} alt={alt} style={{
    display: 'inline',
    verticalAlign: 'start',
    height: height,
    margin: '0'
  }} />;
};

## Intro

<Note>
  **Note:** This article is for the old Magic ETL. For information on the new Magic ETL, see [Magic ETL](/s/topic/0TO5w000000ZanvGAC).
</Note>

This article describes in detail most of the **Edit Columns** tiles in Magic ETL, including the following:

* Add Constants
* Calculator
* Collapse Columns
* Combine Columns
* Date Operations
* Group By
* Select Columns
* Set Column Type
* Split Column
* Uncollapse Columns

This topic does not discuss the Rank & Window tiles. For information about these tiles, see [Magic ETL Tiles: Rank and Window](/s/article/360042922814 "ETL Actions: Rank and Window").

For information about creating a Magic ETL DataFlow, see Creating a Magic ETL DataFlow.

For information about the Data Center, see [Data Center Layout](https://domo-support.domo.com/s/article/360047553253?language=en_US).

## Add Constants

The Add Constants tile lets you add a column with constant values.

**To configure the Add Constants tile,**

1. Click the **Add Constants** tile in the canvas.

2. (Optional) Rename the tile by clicking
   <InlineImage src="/images/kb/ka05w00000122yV-00N5w00000Ri7BU-0EM5w000005vNgL.png" />, then entering the name you want.

3. Enter the name of the new column.

4. Select the column type.

   <table border="1" cellpadding="1" cellspacing="1"><thead><tr><th colspan="1" rowspan="1"><p> Column Type </p></th><th colspan="1" rowspan="1"><p> Description </p></th></tr></thead><tbody><tr><td colspan="1" rowspan="1"><p> Text </p></td><td colspan="1" rowspan="1"><p> Contains text and numbers (which are treated as text). </p></td></tr><tr><td colspan="1" rowspan="1"><p> Decimal </p></td><td colspan="1" rowspan="1"><p> Contains numbers in decimal notation. </p></td></tr><tr><td colspan="1" rowspan="1"><p> Decimal (Fixed) </p></td><td colspan="1" rowspan="1"><p> Contains decimal numbers with a fixed number of digits after the decimal point. </p></td></tr><tr><td colspan="1" rowspan="1"><p> Whole Number </p></td><td colspan="1" rowspan="1"><p> Contains numbers without a decimal part. </p></td></tr><tr><td colspan="1" rowspan="1"><p> Date </p></td><td colspan="1" rowspan="1"><p> Contains date values. </p></td></tr><tr><td colspan="1" rowspan="1"><p> Date and Time </p></td><td colspan="1" rowspan="1"><p> Contains date and time values. </p></td></tr></tbody></table>

5. Enter the constant value, date, date and time, or leave it blank.

<Tip>
  **Tip:** You can preview the data transformed by a tile by running a preview, clicking the tile in the canvas, then clicking the **Preview** tab.
</Tip>

## Calculator

The Calculator tile lets you add a column with values from a simple calculation.

**To configure the Calculator tile,**

1. Click the **Calculator** tile in the canvas.

2. (Optional) Rename the tile by clicking
   <InlineImage src="/images/kb/ka05w00000122yV-00N5w00000Ri7BU-0EM5w000005vNgL.png" />, then entering the name you want.

3. Enter the name of the new column.

4. Select the operation you want.

   <table border="1" cellpadding="1" cellspacing="1"><thead><tr><th colspan="1" rowspan="1"><p> Operation </p></th><th colspan="1" rowspan="1"><p> Description </p></th></tr></thead><tbody><tr><td colspan="1" rowspan="1"><p> Addition </p></td><td colspan="1" rowspan="1"><p> Adds values from two columns. </p></td></tr><tr><td colspan="1" rowspan="1"><p> Subtrtile </p></td><td colspan="1" rowspan="1"><p> Subtracts values from two columns. </p></td></tr><tr><td colspan="1" rowspan="1"><p> Multiplication </p></td><td colspan="1" rowspan="1"><p> Multiplies values from two columns. </p></td></tr><tr><td colspan="1" rowspan="1"><p> Division </p></td><td colspan="1" rowspan="1"><p> Divides values from two columns. </p></td></tr><tr><td colspan="1" rowspan="1"><p> Ceiling </p></td><td colspan="1" rowspan="1"><p> Returns the highest value for each series in a numeric column. </p></td></tr><tr><td colspan="1" rowspan="1"><p> Floor </p></td><td colspan="1" rowspan="1"><p> Returns the lowest value for each series in a numeric column. </p></td></tr></tbody></table>

5. Select the columns to use or specify the values you want.

<Tip>
  **Tip:** You can preview the data transformed by a tile by running a preview, clicking the tile in the canvas, then clicking the **Preview** tab.
</Tip>

## Collapse Columns

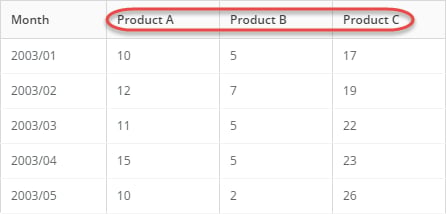
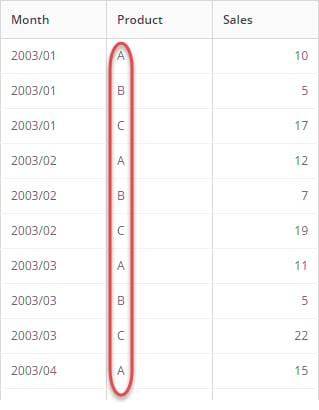
The Collapse Columns tile lets you "unpivot" or "normalize" data in tables, transforming multiple columns in a single row into a single column with multiple rows. This tile is useful only for unpivoting data in which the number of columns stays the same. If you add another column of data to the original file, this tile does not collapse or unpivot the new column.

**Example**

For example, the Collapse Columns tile converts data in this pivoted format...

<Frame>
  <img alt="etl_rownormalizer_datain.png" src="https://mintcdn.com/domoinc-openapi-sync-dataflows/YY6W1U347GpqLSJS/images/kb/ka05w00000124U6-00N5w00000Ri7BU-0EM5w000005vNi7.png?fit=max&auto=format&n=YY6W1U347GpqLSJS&q=85&s=e1b156a503324afd0a1976a825bc14ce" width="446" height="214" data-path="images/kb/ka05w00000124U6-00N5w00000Ri7BU-0EM5w000005vNi7.png" />
</Frame>

... to data in this format...

<Frame>
  <img alt="etl_rownormalizer_dataout.png" src="https://mintcdn.com/domoinc-openapi-sync-dataflows/YY6W1U347GpqLSJS/images/kb/ka05w00000124U6-00N5w00000Ri7BU-0EM5w000005vNi3.png?fit=max&auto=format&n=YY6W1U347GpqLSJS&q=85&s=a6d7249b475fdf7cbd9401ceadfa7be3" width="319" height="410" data-path="images/kb/ka05w00000124U6-00N5w00000Ri7BU-0EM5w000005vNi3.png" />
</Frame>

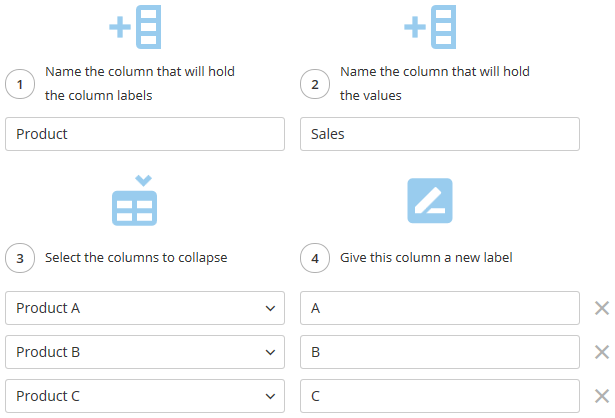
... using this configuration:

<Frame>
  <img alt="etl_rownormalizer_sampleui.png" src="https://mintcdn.com/domoinc-openapi-sync-dataflows/YY6W1U347GpqLSJS/images/kb/ka05w00000124U6-00N5w00000Ri7BU-0EM5w000005vNh2.png?fit=max&auto=format&n=YY6W1U347GpqLSJS&q=85&s=47a686538d7624d624cd13271354f9f9" width="615" height="418" data-path="images/kb/ka05w00000124U6-00N5w00000Ri7BU-0EM5w000005vNh2.png" />
</Frame>

**To configure the Collapse Columns tile,**

1. Click the **Collapse Columns** tile in the canvas.
2. (Optional) Rename the tile by clicking the edit icon, then entering the name you want.
3. Enter the name of the column you want to create to contain the column headings from the columns to collapse.

   For example, "Product".
4. Enter the name of the column you want to create to contain the row values from the columns to be collapsed.

   For example, "Sales".
5. For each column you want to collapse, do the following:

   1. Select a column to normalize.

      For example, "Product A".
   2. Enter a value representing the column header to be normalized.

      The value appears in the row of the new column. For example, "A".
   3. (Conditional) If you want to collapse another column, then click **Add Column**.

<Tip>
  **Tip:** You can preview the data transformed by a tile by running a preview, clicking the tile in the canvas, then clicking the **Preview** tab.
</Tip>

## Combine Columns

The Combine Columns tile lets you combine values from multiple columns into one column. For example, you could combine first name and last name from two columns into a new, full name column.

**Video - Combining Columns in Magic ETL**

<iframe allowfullscreen="" frameborder="1" height="315" src="//www.youtube-nocookie.com/embed/MTsusfED1lI" width="560" />

**To configure the Combine Columns tile,**

1. Click the **Combine Columns** tile in the canvas.
2. (Optional) Rename the tile by clicking
   <InlineImage src="/images/kb/ka05w00000122yV-00N5w00000Ri7BU-0EM5w000005vNgL.png" />, then entering the name you want.
3. Enter the name of the new column.
4. Specify the character to use to separate the combined values.
5. (Optional) Remove the original columns after they are combined.
6. Select the columns to combine.

<Tip>
  **Tip:** You can preview the data transformed by a tile by running a preview, clicking the tile in the canvas, then clicking the **Preview** tab.
</Tip>

## Date Operations

The Date Operations tile lets you add a column with values from a date-based calculation.

**To configure the Date Operations tile,**

1. Click the **Date Operations** tile in the canvas.

2. (Optional) Rename the tile by clicking
   <InlineImage src="/images/kb/ka05w00000122yV-00N5w00000Ri7BU-0EM5w000005vNgL.png" />, then entering the name you want.

3. Enter the name of the new column.

4. Select the date operation you want.

   <table border="1" cellpadding="1" cellspacing="1"><thead><tr><th colspan="1" rowspan="1"><p> Operation </p></th><th colspan="1" rowspan="1"><p> Description </p></th></tr></thead><tbody><tr><td colspan="1" rowspan="1"><p> Add to date </p></td><td colspan="1" rowspan="1"><p> Returns the result of adding a unit of measurement to values in a date column. Units of measurement include months, weeks, days, hours, minutes, seconds, or milliseconds. </p></td></tr><tr><td colspan="1" rowspan="1"> Subtract from date </td><td colspan="1" rowspan="1"> Returns the result of subtracting a unit of measurement from values in a date column. Units of measurement include months, weeks, days, hours, minutes, seconds, or milliseconds. </td></tr><tr><td colspan="1" rowspan="1"> Difference between dates </td><td colspan="1" rowspan="1"> Returns the difference in a unit of measurement between two dates. Units of measurement include days, working days, hours, minutes, seconds, milliseconds. </td></tr><tr><td colspan="1" rowspan="1"><p> Year of date </p></td><td colspan="1" rowspan="1"><p> Returns the year for values in a date column. </p></td></tr><tr><td colspan="1" rowspan="1"><p> Quarter of date </p></td><td colspan="1" rowspan="1"><p> Returns the quarter for values in a date column. </p></td></tr><tr><td colspan="1" rowspan="1"><p> Month of date </p></td><td colspan="1" rowspan="1"><p> Returns the month for values in a date column. </p></td></tr><tr><td colspan="1" rowspan="1"><p> Day of year </p></td><td colspan="1" rowspan="1"><p> Returns the numerical day of the year for values in a date column. </p></td></tr><tr><td colspan="1" rowspan="1"><p> Day of month </p></td><td colspan="1" rowspan="1"><p> Returns the numerical day of the month for values in a date column. </p></td></tr><tr><td colspan="1" rowspan="1"><p> Day of week </p></td><td colspan="1" rowspan="1"><p> Returns the numerical day of the week for values in a date column. </p></td></tr><tr><td colspan="1" rowspan="1"><p> Week of year </p></td><td colspan="1" rowspan="1"><p> Returns the numerical week for values in a date column. Weeks are Sun-Sat. Week 1 is the first week with a Saturday in this year. </p></td></tr></tbody></table>

5. Select the columns to use or specify the values you want.

<Tip>
  **Tip:** You can preview the data transformed by a tile by running a preview, clicking the tile in the canvas, then clicking the **Preview** tab.
</Tip>

## Group By

The Group By tile lets you aggregate values from multiple columns into one column. For example, you could calculate the average sales per product or get the number of yellow shirts in stock.

**Video - Using Group By in Magic ETL**

<iframe allowfullscreen="" frameborder="1" height="315" src="//www.youtube-nocookie.com/embed/K4kojE3v5uU" width="560" />

**To configure the Group By tile,**

1. Click the **Group By** tile in the canvas.
2. (Optional) Rename the tile by clicking
   <InlineImage src="/images/kb/ka05w00000122yV-00N5w00000Ri7BU-0EM5w000005vNgL.png" />, then entering the name you want.
3. Select the columns in the grouping.
4. For each column you want to add, do the following:

   1. Enter the name of the new column.

   2. Select the columns to aggregate and fill the new column.

   3. Select the aggregation type to use.

      <table border="1" cellpadding="1" cellspacing="1"><thead><tr><th colspan="1" rowspan="1"><p> Type </p></th><th colspan="1" rowspan="1"><p> Description </p></th><th colspan="1" rowspan="1"><p> Data Types Available For </p></th></tr></thead><tbody><tr><td colspan="1" rowspan="1"><p> Count </p></td><td colspan="1" rowspan="1"><p> Returns the number of non-null values in the column. </p></td><td colspan="1" rowspan="1"><p> Decimal, Whole Number, Text, Date </p></td></tr><tr><td colspan="1" rowspan="1"><p> Count including nulls </p></td><td colspan="1" rowspan="1"><p> Returns the number of all values in the column, including nulls. </p></td><td colspan="1" rowspan="1"><p> Decimal, Whole Number, Text, Date </p></td></tr><tr><td colspan="1" rowspan="1"><p> Count distinct </p></td><td colspan="1" rowspan="1"><p> Returns the number of unique values in the column. </p></td><td colspan="1" rowspan="1"><p> Decimal, Whole Number, Text, Date </p></td></tr><tr><td colspan="1" rowspan="1"><p> First non-null value </p></td><td colspan="1" rowspan="1"><p> Returns the first non-null value. </p></td><td colspan="1" rowspan="1"><p> Decimal, Whole Number, Text, Date </p></td></tr><tr><td colspan="1" rowspan="1"><p> Last non-null value </p></td><td colspan="1" rowspan="1"><p> Returns the last non-null value. </p></td><td colspan="1" rowspan="1"><p> Decimal, Whole Number, Text, Date </p></td></tr><tr><td colspan="1" rowspan="1"><p> First value </p></td><td colspan="1" rowspan="1"><p> Returns the first value (including null). </p></td><td colspan="1" rowspan="1"><p> Decimal, Whole Number, Text, Date </p></td></tr><tr><td colspan="1" rowspan="1"><p> Last value </p></td><td colspan="1" rowspan="1"><p> Returns the last value (including null). </p></td><td colspan="1" rowspan="1"><p> Decimal, Whole Number, Text, Date </p></td></tr><tr><td colspan="1" rowspan="1"><p> Sum </p></td><td colspan="1" rowspan="1"><p> Sums all of the values in the column. </p></td><td colspan="1" rowspan="1"><p> Decimal, Whole Number </p></td></tr><tr><td colspan="1" rowspan="1"><p> Average </p></td><td colspan="1" rowspan="1"><p> Returns the average of all of the values in the column. </p></td><td colspan="1" rowspan="1"><p> Decimal, Whole Number </p></td></tr><tr><td colspan="1" rowspan="1"><p> Median </p></td><td colspan="1" rowspan="1"><p> Returns the median of all of the values in the column. </p></td><td colspan="1" rowspan="1"><p> Decimal, Whole Number </p></td></tr><tr><td colspan="1" rowspan="1"><p> Minimum </p></td><td colspan="1" rowspan="1"><p> Returns the minimum value in the column. </p></td><td colspan="1" rowspan="1"><p> Decimal, Whole Number, Date </p></td></tr><tr><td colspan="1" rowspan="1"><p> Maximum </p></td><td colspan="1" rowspan="1"><p> Returns the maximum value in the column. </p></td><td colspan="1" rowspan="1"><p> Decimal, Whole Number, Date </p></td></tr><tr><td colspan="1" rowspan="1"><p> Standard deviation </p></td><td colspan="1" rowspan="1"><p> Returns the standard deviation for the values in the column. </p></td><td colspan="1" rowspan="1"><p> Decimal, Whole Number </p></td></tr><tr><td colspan="1" rowspan="1"><p> Combine strings separated by, </p></td><td colspan="1" rowspan="1"><p> Combines all of the text values in the column, separating them with commas. </p></td><td colspan="1" rowspan="1"><p> Text </p></td></tr></tbody></table>

   4. (Conditional) If you want to add a column, then click **Add Column**.

      <Tip>
        **Tip:** You can preview the data transformed by a tile by running a preview, clicking the tile in the canvas, then clicking the **Preview** tab.
      </Tip>

## Select Columns

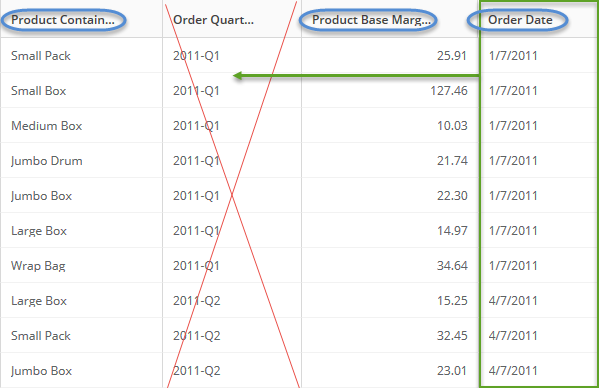
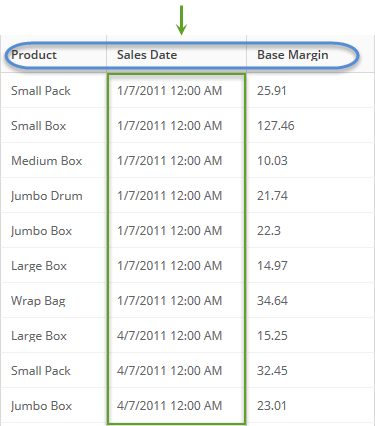
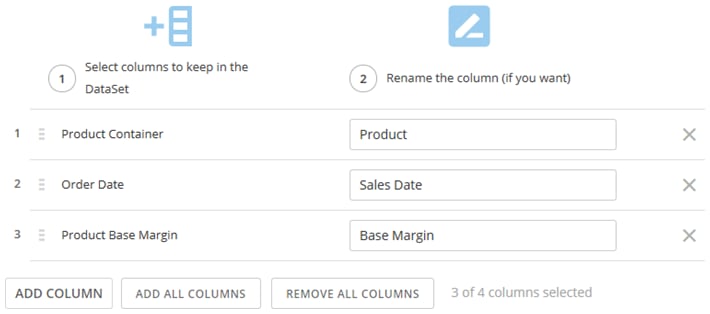
The Select Columns tile lets you select columns to include, reorder columns, and rename column headings.

**Example**

For example, the Select Columns tile transforms these columns in this data...

<Frame>
  <img alt="etl_selectcolumns_datain.png" src="https://mintcdn.com/domoinc-openapi-sync-dataflows/YY6W1U347GpqLSJS/images/kb/ka05w00000124U6-00N5w00000Ri7BU-0EM5w000005vNhG.png?fit=max&auto=format&n=YY6W1U347GpqLSJS&q=85&s=64a9101c92212ac9299e934ef3e8b9f6" width="599" height="388" data-path="images/kb/ka05w00000124U6-00N5w00000Ri7BU-0EM5w000005vNhG.png" />
</Frame>

... to this...

<Frame>
  <img alt="etl_selectcolumns_dataout.png" src="https://mintcdn.com/domoinc-openapi-sync-dataflows/YY6W1U347GpqLSJS/images/kb/ka05w00000124U6-00N5w00000Ri7BU-0EM5w000005vNhT.png?fit=max&auto=format&n=YY6W1U347GpqLSJS&q=85&s=97d8c74215a9ef36d8fa074ed2c2d803" width="375" height="426" data-path="images/kb/ka05w00000124U6-00N5w00000Ri7BU-0EM5w000005vNhT.png" />
</Frame>

... using this configuration:

<Frame>
  <img alt="etl_selectcolumns_sampleui.png" src="https://mintcdn.com/domoinc-openapi-sync-dataflows/YY6W1U347GpqLSJS/images/kb/ka05w00000124U6-00N5w00000Ri7BU-0EM5w000005vNh6.png?fit=max&auto=format&n=YY6W1U347GpqLSJS&q=85&s=7faab63666c77b4092a67a19dc726b4b" width="710" height="314" data-path="images/kb/ka05w00000124U6-00N5w00000Ri7BU-0EM5w000005vNh6.png" />
</Frame>

**Video - Renaming Fields in Magic ETL**

<iframe allowfullscreen="" frameborder="1" height="315" src="//www.youtube-nocookie.com/embed/QoqDBhAeb5s" width="560" />

**To configure the Select Columns tile,**

1. Click the **Select Columns** tile in the canvas.
2. (Optional) Rename the tile by clicking
   <InlineImage src="/images/kb/ka05w00000122yV-00N5w00000Ri7BU-0EM5w000005vNgL.png" />, then entering the name you want.
3. Select the columns you want to include (or exclude) by doing any of the following:

   1. Click **Add Column**, select a column you want. Repeat to add other columns.
   2. Click **Add All Columns**, then exclude columns by clicking the X associated with the column.

      For example, remove "Order Quarter".
4. Reorder columns by clicking
   <InlineImage src="/images/kb/ka05w00000124U6-00N5w00000Ri7BU-0EM5w000005vNgy.png" /> and dragging a column to the order position you want.

   For example, moving "Order Date" after "Product Container".
5. For each column heading you want to rename, enter the new name of the column heading.

   For example, renaming "Product Base Margin" to "Base Margin".

   <Tip>
     **Tip:** You can preview the data transformed by a tile by running a preview, clicking the tile in the canvas, then clicking the **Preview** tab.
   </Tip>

## Set Column Type

The Set Column Type tile lets you change the data type of a column (for example, from number to text). For more information about data types, see [Understanding Chart Data](/s/article/360043428693 "Understanding Chart Data").

**Example**

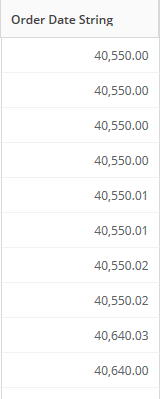
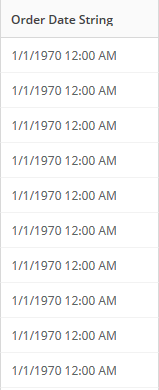
For example, the Set Column Type tile transforms this data...

<Frame>
  <img alt="etl_setcolumntype_datain.png" src="https://mintcdn.com/domoinc-openapi-sync-dataflows/YY6W1U347GpqLSJS/images/kb/ka05w00000124U6-00N5w00000Ri7BU-0EM5w000005vNi5.png?fit=max&auto=format&n=YY6W1U347GpqLSJS&q=85&s=c83919b26845064a15b0888860a6d064" width="160" height="399" data-path="images/kb/ka05w00000124U6-00N5w00000Ri7BU-0EM5w000005vNi5.png" />
</Frame>

<Note>
  **Note:** Before the transformation, the values were actually date-time values but did not display as such because they were set to a Text data type. After the transformation, the actual values display properly as date-time values.
</Note>

... to this...

<Frame>
  <img alt="etl_setcolumntype_dataout.png" src="https://mintcdn.com/domoinc-openapi-sync-dataflows/YY6W1U347GpqLSJS/images/kb/ka05w00000124U6-00N5w00000Ri7BU-0EM5w000005vNhE.png?fit=max&auto=format&n=YY6W1U347GpqLSJS&q=85&s=086f7b0e28ea7ddfd5ce39523108a37b" width="159" height="390" data-path="images/kb/ka05w00000124U6-00N5w00000Ri7BU-0EM5w000005vNhE.png" />
</Frame>

... using this configuration:

<Frame>
  <img alt="etl_setcolumntype_sampleui__1_.png" src="https://mintcdn.com/domoinc-openapi-sync-dataflows/YY6W1U347GpqLSJS/images/kb/ka05w00000124TD-00N5w00000Ri7BU-0EM5w000005vNfs.png?fit=max&auto=format&n=YY6W1U347GpqLSJS&q=85&s=e8e2253d940883a15176646b4fa6bfa2" width="710" height="126" data-path="images/kb/ka05w00000124TD-00N5w00000Ri7BU-0EM5w000005vNfs.png" />
</Frame>

**To configure the Set Column Type tile,**

1. Click the **Set Column Type** tile in the canvas.
2. (Optional) Rename the tile by clicking
   <InlineImage src="/images/kb/ka05w00000122yV-00N5w00000Ri7BU-0EM5w000005vNgL.png" />, then entering the name you want.
3. For each column where you want to set the data type, do the following:

   1. Select the column you want to set.

      For example, "Order Date String".

   2. Select the data type you want for the column.

      <table border="1" cellpadding="1" cellspacing="1"><thead><tr><th colspan="1" rowspan="1"><p> Data Type </p></th><th colspan="1" rowspan="1"><p> Description </p></th></tr></thead><tbody><tr><td colspan="1" rowspan="1"><p> Text </p></td><td colspan="1" rowspan="1"><p> Contains string values. </p></td></tr><tr><td colspan="1" rowspan="1"><p> Decimal </p></td><td colspan="1" rowspan="1"><p> Contains numbers in decimal notation. </p></td></tr><tr><td colspan="1" rowspan="1"><p> Decimal (Fixed) </p></td><td colspan="1" rowspan="1"><p> Contains decimal numbers with a fixed number of digits after the decimal point. </p></td></tr><tr><td colspan="1" rowspan="1"><p> Whole Number </p></td><td colspan="1" rowspan="1"><p> Contains numbers without a decimal part. </p></td></tr><tr><td colspan="1" rowspan="1"><p> Date </p></td><td colspan="1" rowspan="1"><p> Contains date values. </p></td></tr><tr><td colspan="1" rowspan="1"><p> Date and Time </p></td><td colspan="1" rowspan="1"><p> Contains date and time values. </p></td></tr></tbody></table>

   3. (Conditional) If you want to add another column, then click **Add Column**.

      <Tip>
        **Tip:** You can preview the data transformed by a tile by running a preview, clicking the tile in the canvas, then clicking the **Preview** tab.
      </Tip>

## Split Column

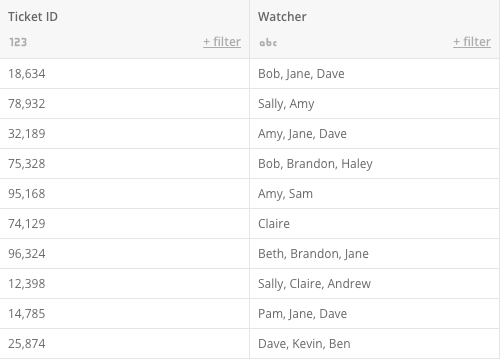
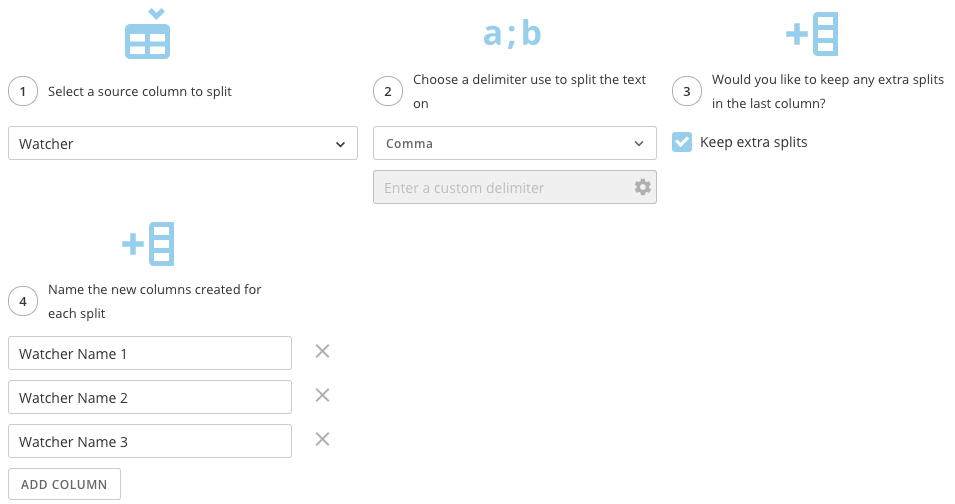
The Split Column tile lets you split a single string column into multiple columns by a specific delimiter.

**Example**

For example, the Split Column tile converts data in this format...

<Frame>
  <img alt="Split_Column_Table.png" src="https://mintcdn.com/domoinc-openapi-sync-dataflows/YY6W1U347GpqLSJS/images/kb/ka05w00000124U6-00N5w00000Ri7BU-0EM5w000005vNh0.png?fit=max&auto=format&n=YY6W1U347GpqLSJS&q=85&s=f9ef66858098a2f395f6959ae659892b" width="500" height="359" data-path="images/kb/ka05w00000124U6-00N5w00000Ri7BU-0EM5w000005vNh0.png" />
</Frame>

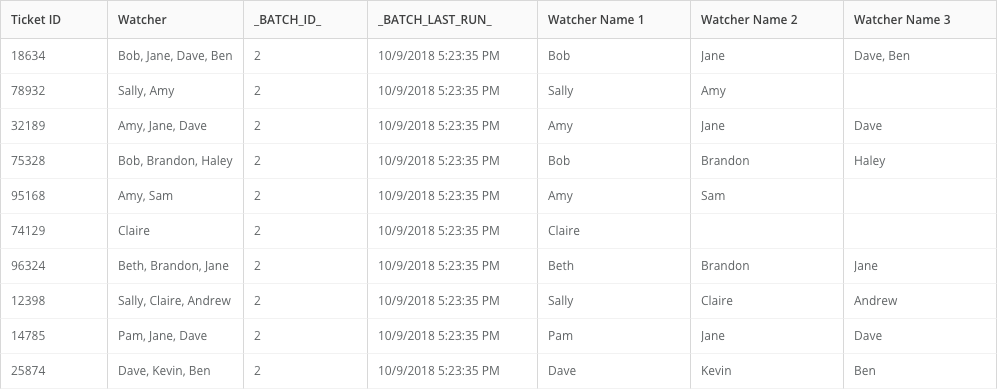
...to data in this format...

<Frame>
  <img alt="Split_String_ETL.png" src="https://mintcdn.com/domoinc-openapi-sync-dataflows/YY6W1U347GpqLSJS/images/kb/ka05w00000124U6-00N5w00000Ri7BU-0EM5w000005vNiC.png?fit=max&auto=format&n=YY6W1U347GpqLSJS&q=85&s=3165043947ab9c7668df7bc4017a6e32" width="997" height="390" data-path="images/kb/ka05w00000124U6-00N5w00000Ri7BU-0EM5w000005vNiC.png" />
</Frame>

...using this configuration:

<Frame>
  <img alt="Split_Column_Configuration.png" src="https://mintcdn.com/domoinc-openapi-sync-dataflows/YY6W1U347GpqLSJS/images/kb/ka05w00000124U6-00N5w00000Ri7BU-0EM5w000005vNi0.png?fit=max&auto=format&n=YY6W1U347GpqLSJS&q=85&s=b4bdc2cd9937d957c9a707a9f053384f" width="955" height="504" data-path="images/kb/ka05w00000124U6-00N5w00000Ri7BU-0EM5w000005vNi0.png" />
</Frame>

**To configure the Split Column tile,**

1. Click the **Split Column** tile in the canvas.
2. (Optional) Rename the tile by clicking
   <InlineImage src="/images/kb/ka05w00000122yV-00N5w00000Ri7BU-0EM5w000005vNgL.png" />, then entering the name you want.
3. Select the column you want to split.
4. Choose the delimiter on which the string should be separated.
5. Next, decide whether to keep the extra splits in the last column specified in step 4.

   For example, in row 1 in the table above, the extra split Ben exists in the last column Watcher Split 1.
6. Lastly, add and name as many columns as needed.

   In the example above, you can see there are some rows that did not have 3 values to split, so those values remain blank in those columns.

   <Note>
     **Note:** If you have more values to split than columns created and choose to not keep the extra splits, the values are not placed in any column.
   </Note>

## Uncollapse Columns

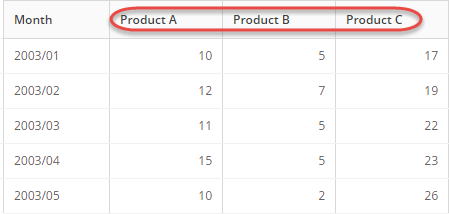
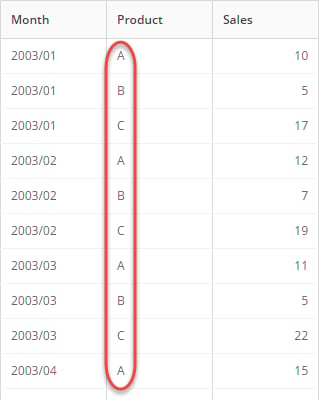
The Uncollapse Columns tile lets you "pivot" or de-normalize data in tables using key-value pairs, transforming a single column with multiple rows into multiple columns in a single row.

<Note>
  **Note:** If you create a table that reaches the 1500 column limit, you will receive an error. You must reduce the number of columns to continue running your Magic ETL DataFlow.
</Note>

**Example**

For example, the Uncollapse Columns tile converts data in this format...

<Frame>
  <img alt="etl_rowdenormalizer_datain.png" src="https://mintcdn.com/domoinc-openapi-sync-dataflows/YY6W1U347GpqLSJS/images/kb/ka05w00000124U6-00N5w00000Ri7BU-0EM5w000005vNhH.png?fit=max&auto=format&n=YY6W1U347GpqLSJS&q=85&s=a985a60883f2c90bacaa7320f9d04859" width="319" height="410" data-path="images/kb/ka05w00000124U6-00N5w00000Ri7BU-0EM5w000005vNhH.png" />
</Frame>

... to data in this format...

<Frame>
  <img alt="etl_rowdenormalizer_dataout.png" src="https://mintcdn.com/domoinc-openapi-sync-dataflows/YY6W1U347GpqLSJS/images/kb/ka05w00000124U6-00N5w00000Ri7BU-0EM5w000005vNi9.png?fit=max&auto=format&n=YY6W1U347GpqLSJS&q=85&s=a0950ec8aa9df2c9195179c8db351a82" width="449" height="214" data-path="images/kb/ka05w00000124U6-00N5w00000Ri7BU-0EM5w000005vNi9.png" />
</Frame>

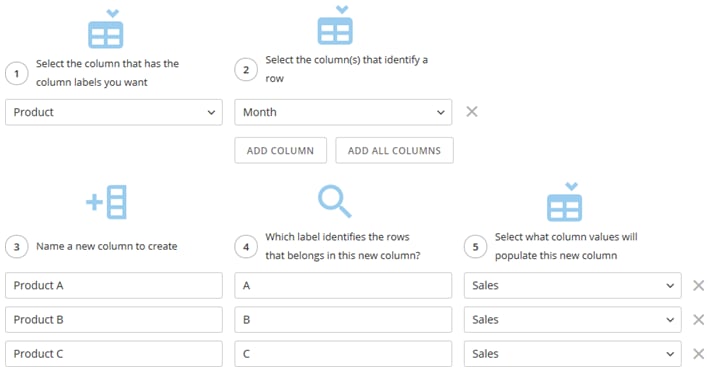
... using this configuration:

<Frame>
  <img alt="etl_rowdenormalizer_sampleui.png" src="https://mintcdn.com/domoinc-openapi-sync-dataflows/YY6W1U347GpqLSJS/images/kb/ka05w00000124U6-00N5w00000Ri7BU-0EM5w000005vNhF.png?fit=max&auto=format&n=YY6W1U347GpqLSJS&q=85&s=5522722f39fd385cebfbece313fb2b62" width="710" height="372" data-path="images/kb/ka05w00000124U6-00N5w00000Ri7BU-0EM5w000005vNhF.png" />
</Frame>

**To configure the Uncollapse Columns tile,**

1. Click the **Uncollapse Columns** tile in the canvas.
2. (Optional) Rename the tile by clicking
   <InlineImage src="/images/kb/ka05w00000122yV-00N5w00000Ri7BU-0EM5w000005vNgL.png" />, then entering the name you want.
3. Enter the name of the key column you want to uncollapse into new column headers.

   For example, "Product".
4. Select the column to use to group the row values of the new columns.

   For example, "Month".
5. For each new column you want to create from the key column, do the following:

   1. Enter the name of the new column header.

      For example, "Product A".
   2. Enter a value from the key column that represents the column header to be uncollapsed.

      For example, "A".
   3. Select the value column to use to fill the row value of the new column.
   4. For example, "Sales".

   <Note>
     **Note:** For each column you add to be uncollapsed, select the same value column.
   </Note>

   5. (Conditional) If you want to add another column, then click **Add Column**.

      <Tip>
        **Tip:** You can preview the data transformed by a tile by running a preview, clicking the tile in the canvas, then clicking the **Preview** tab.
      </Tip>