> ## Documentation Index
> Fetch the complete documentation index at: https://domoinc-openapi-sync-dataflows.mintlify.site/llms.txt
> Use this file to discover all available pages before exploring further.

# High Low Chart

## Intro

High low charts are used to represent rises and falls in stock values. These charts are similar to [candlestick charts](/s/article/360043427993 "Candlestick Graph") but are less complex, requiring only three columns (compared to five for a candlestick chart). For any given category, a vertical or horizontal line is shown depending on which chart type you select. The ends of the lines represent the high and low values respectively.

## Power High Low Charts

High low charts require three columns/rows (depending on whether your chart is vertical or horizontal) of data from your DataSet—one category column/row containing the name of each value or date if you are showing a time progression for a single value; and two columns/rows with the values. One of the columns/rows contains low values and the other contains high values. For information about value, category, and series data, see [Understanding Chart Data](/s/article/360043428693 "Understanding Chart Data").

In Analyzer, you choose the columns containing the data for your high low chart. For more information about choosing data columns, see [Applying DataSet Columns to Your Chart](/s/article/360043428713 "Applying DataSet Columns to Your Chart").

For more information about formatting charts in the Analyzer, see [Visualization Card Building Part 2: The Analyzer.](/s/topic/0TO5w000000ZaoUGAS)

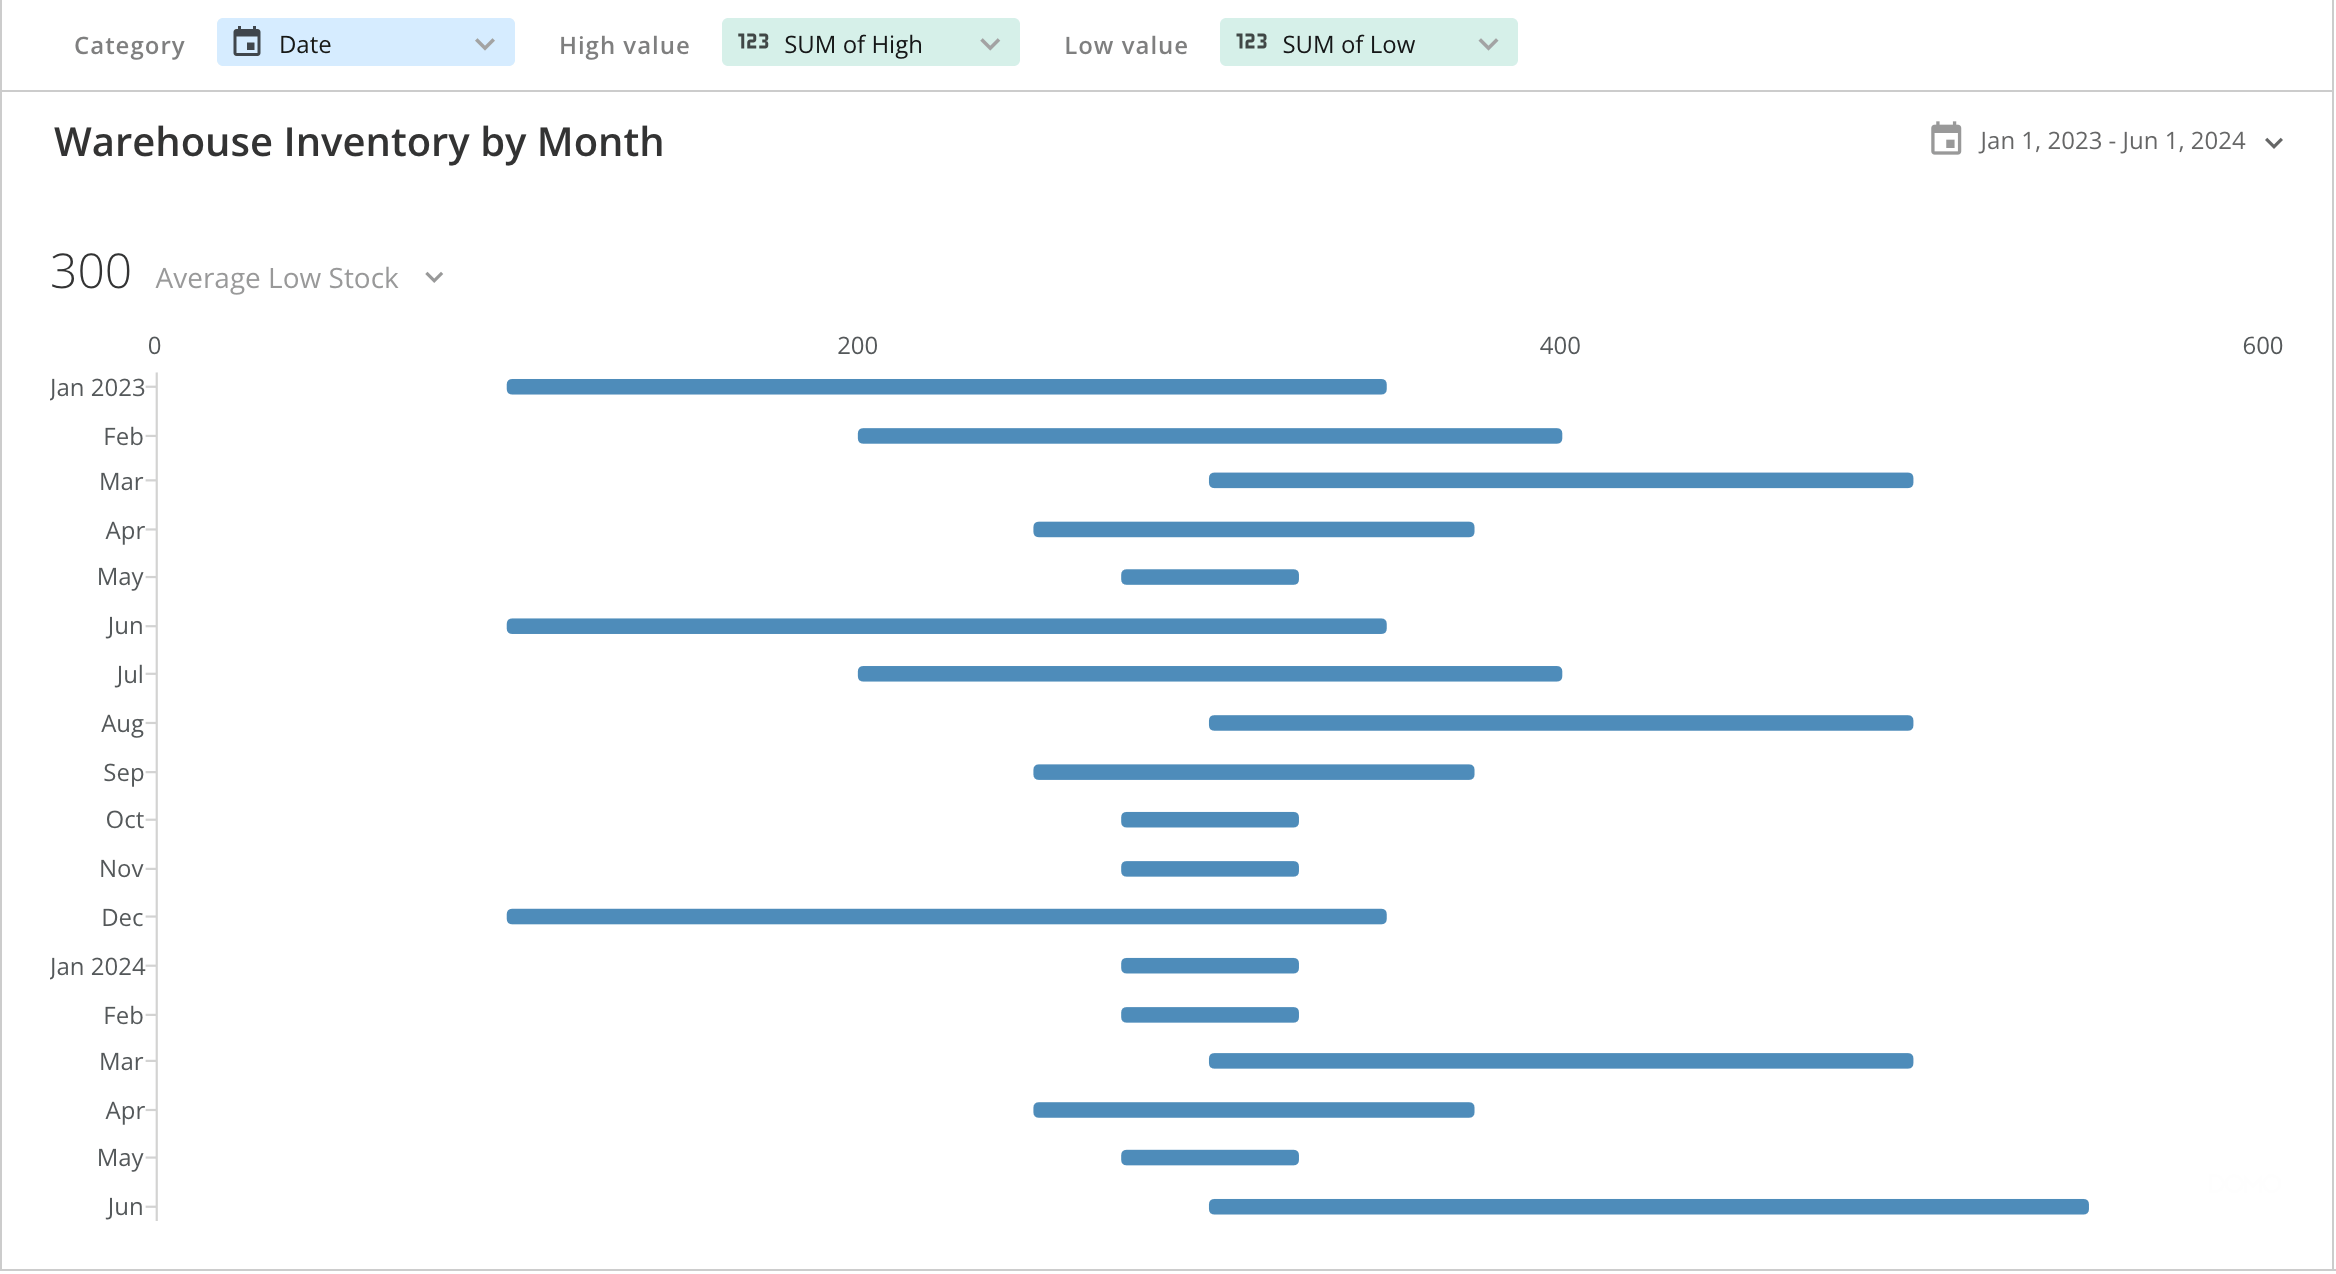
In the following example, the `Warehouse Inventory by Month` horizontal high low chart categorizes the high and low values by month using the `Date` column from the DataSet. The high and low values are on either side of the horizontal line for the associated month.

<Frame>
  <img alt="Screenshot 2024-05-03 at 10.08.26 AM.png" src="https://mintcdn.com/domoinc-openapi-sync-dataflows/RlWZB5sA8DQ5iXJ7/images/kb/ka0Vq0000000nGr-00N5w00000Ri7BU-0EMVq000000t0ll.jpg?fit=max&auto=format&n=RlWZB5sA8DQ5iXJ7&q=85&s=c782f96e9745f01fc945fff800089624" style={{width: 898, height: 490}} width="2336" height="1274" data-path="images/kb/ka0Vq0000000nGr-00N5w00000Ri7BU-0EMVq000000t0ll.jpg" />
</Frame>

## Customize High Low Charts

You can customize the appearance of a high low chart by editing its chart properties. For information about all chart properties, see our [Chart Properties](/s/topic/0TO5w000000ZaodGAC "Chart Properties") article.

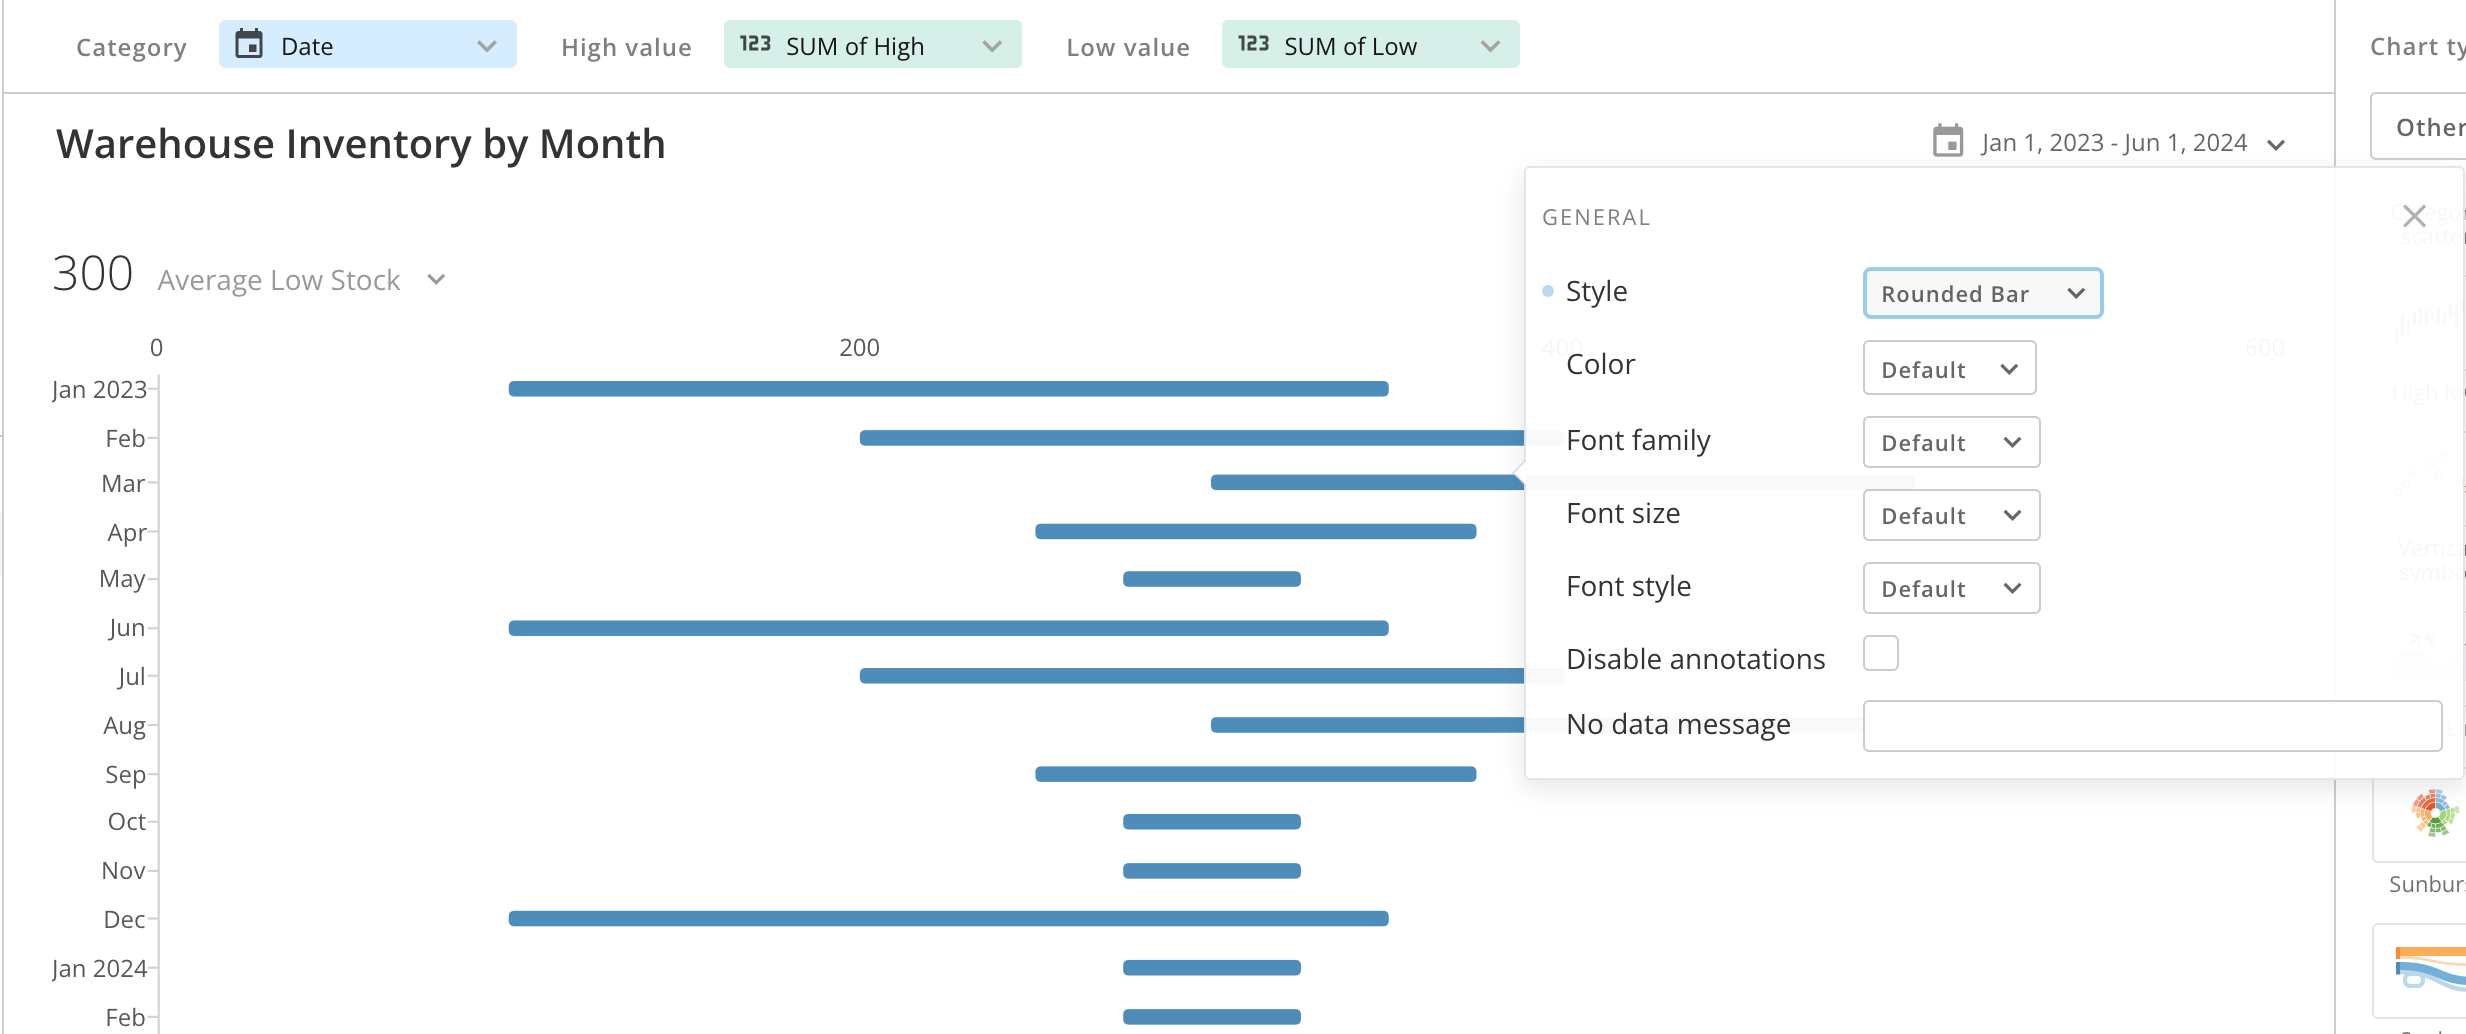
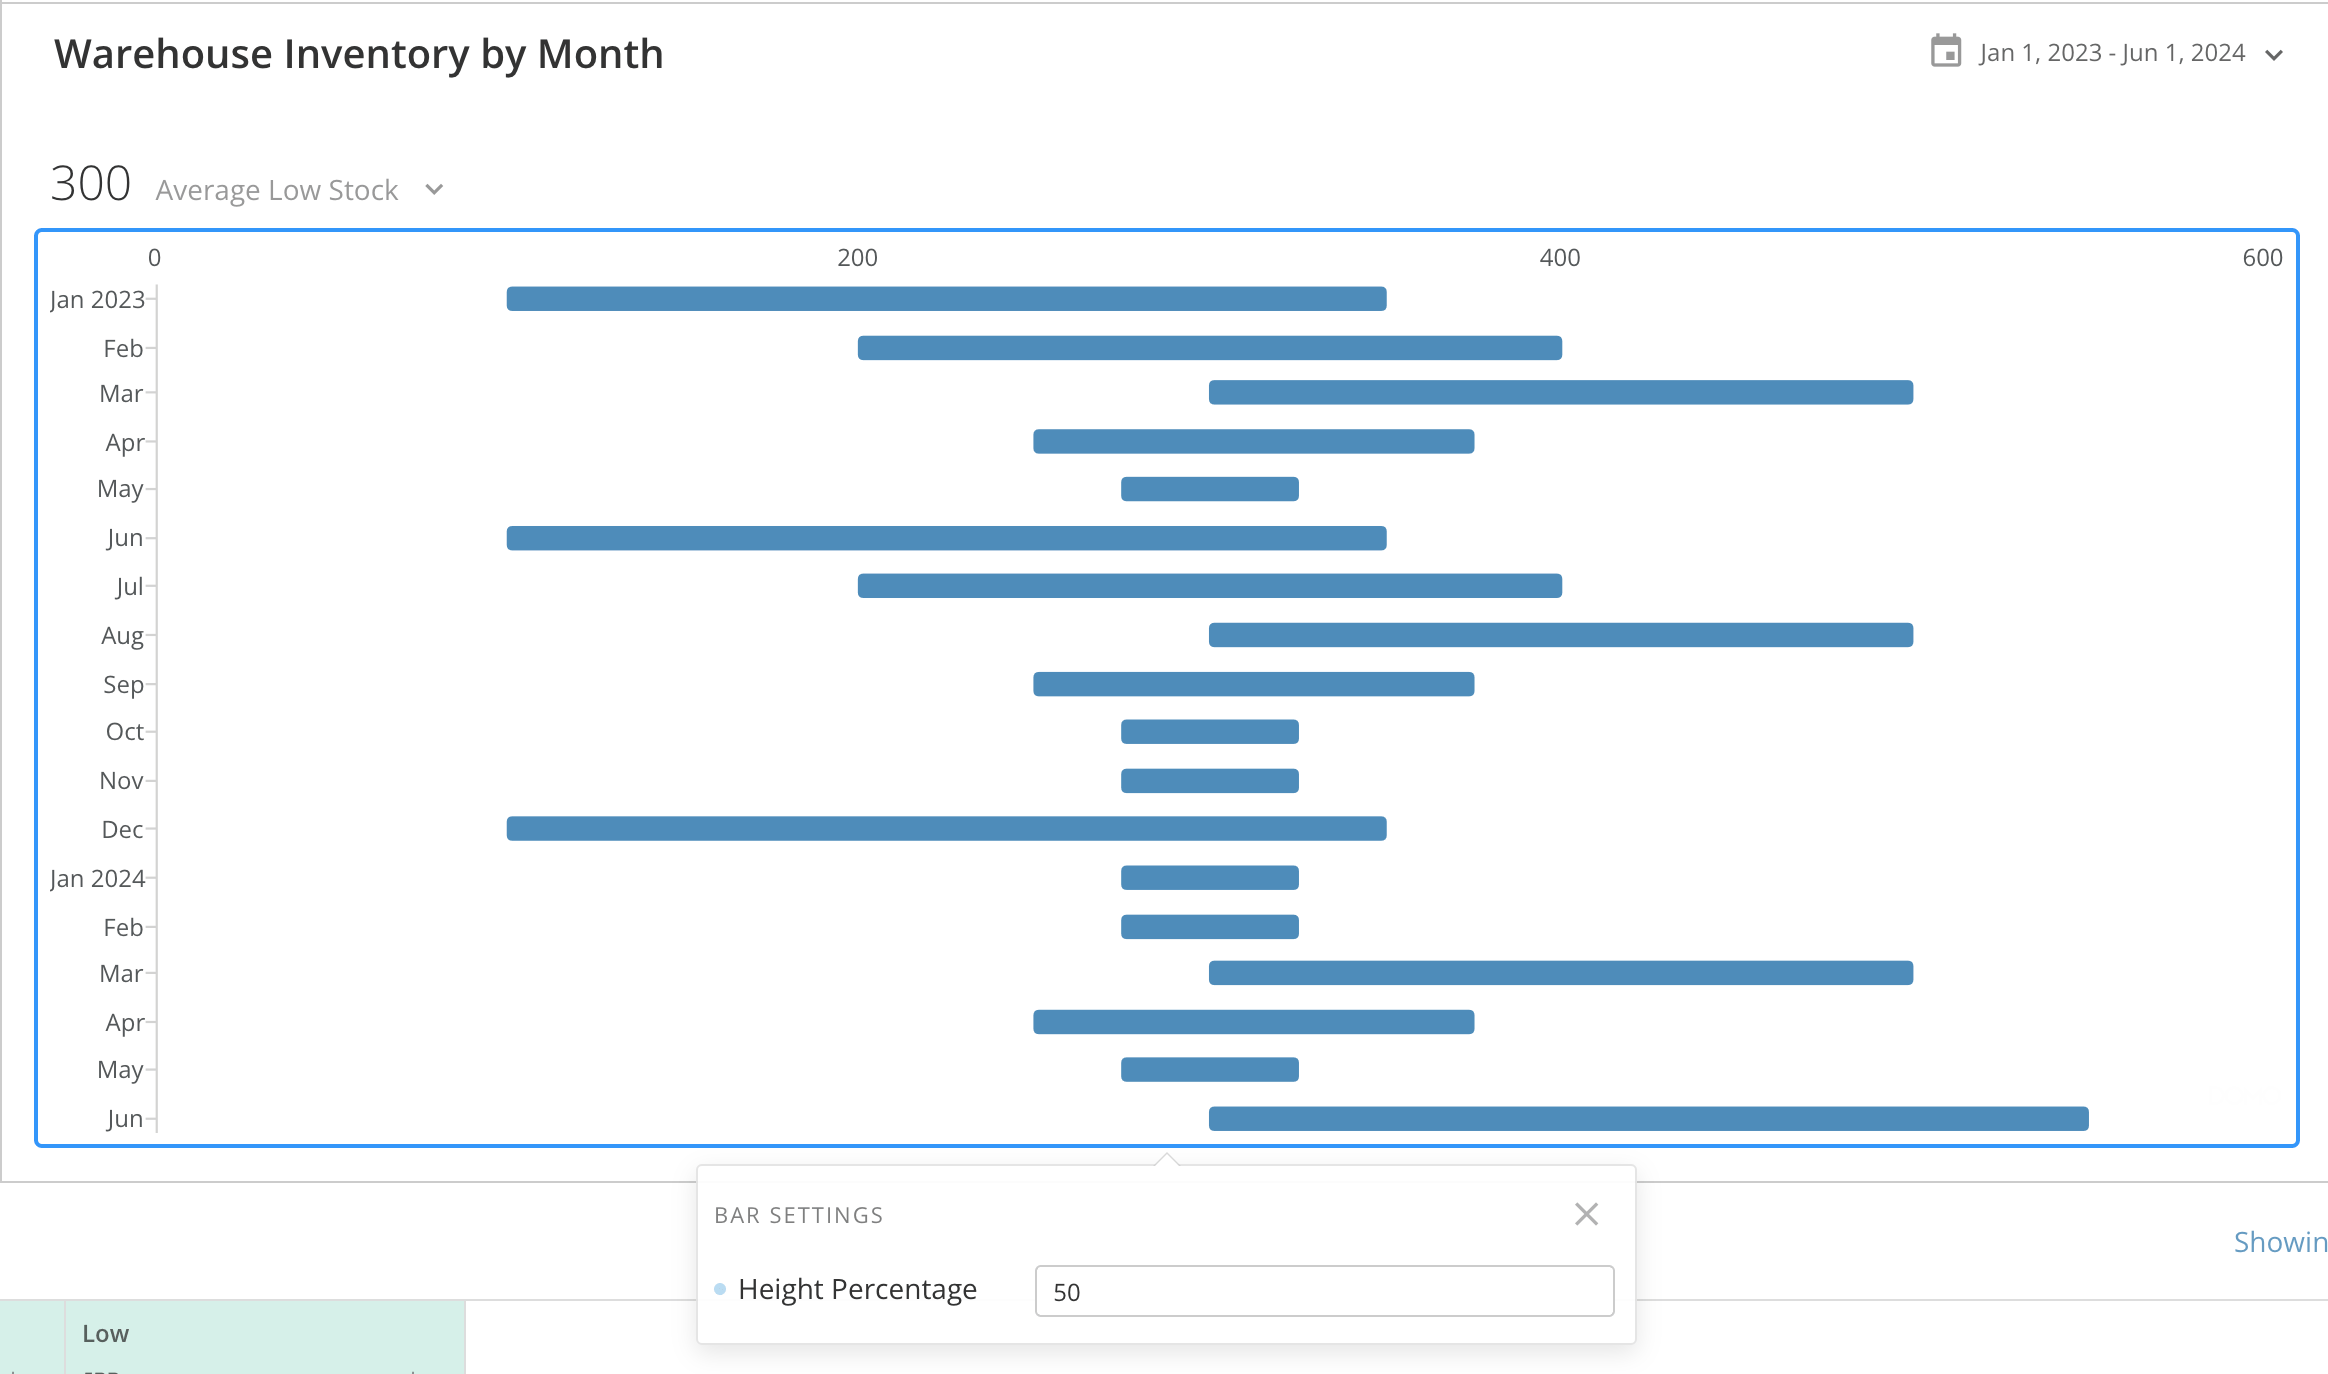
<table border="1" cellpadding="1" cellspacing="1" data-aura-rendered-by="33:205;a"><thead><tr><th colspan="1" rowspan="1"><p> Property </p></th><th colspan="1" rowspan="1"><p> Description </p></th><th colspan="1" rowspan="1"><p> Examples </p></th></tr></thead><tbody><tr><td colspan="1" rowspan="1"><p> General > Style </p></td><td colspan="1" rowspan="1"><p> Allows you to change the style of the lines in your high low chart. The available options include default, line, bar, rounded bar, or lollipop. </p></td><td colspan="1" rowspan="1"><p><img alt="Screenshot 2024-05-03 at 10.40.32 AM.png" src="https://mintcdn.com/domoinc-openapi-sync-dataflows/RlWZB5sA8DQ5iXJ7/images/kb/ka0Vq0000000nGr-00N5w00000Ri7BU-0EMVq000000t1oI.jpg?fit=max&auto=format&n=RlWZB5sA8DQ5iXJ7&q=85&s=bd99072c7069cd5cab53272167e793e5" style={{width: 615, height: 258}} width="2466" height="1034" data-path="images/kb/ka0Vq0000000nGr-00N5w00000Ri7BU-0EMVq000000t1oI.jpg" /></p></td></tr><tr><td colspan="1" rowspan="1"><p> Bar settings > Height Percentage (Horizontal) and Width Percentage (Vertical) </p></td><td colspan="1" rowspan="1"><p> Determines the height or width percentage for each representative line in the high low chart. </p></td><td colspan="1" rowspan="1"><p><img alt="Screenshot 2024-05-03 at 10.44.04 AM.png" src="https://mintcdn.com/domoinc-openapi-sync-dataflows/RlWZB5sA8DQ5iXJ7/images/kb/ka0Vq0000000nGr-00N5w00000Ri7BU-0EMVq000000t30T.jpg?fit=max&auto=format&n=RlWZB5sA8DQ5iXJ7&q=85&s=1d93977215f293e15a678bf647de50ab" style={{width: 715, height: 422}} width="2328" height="1374" data-path="images/kb/ka0Vq0000000nGr-00N5w00000Ri7BU-0EMVq000000t30T.jpg" /></p></td></tr></tbody></table>