> ## Documentation Index
> Fetch the complete documentation index at: https://domoinc-openapi-sync-dataflows.mintlify.site/llms.txt
> Use this file to discover all available pages before exploring further.

# Single Value Gauge

### Intro

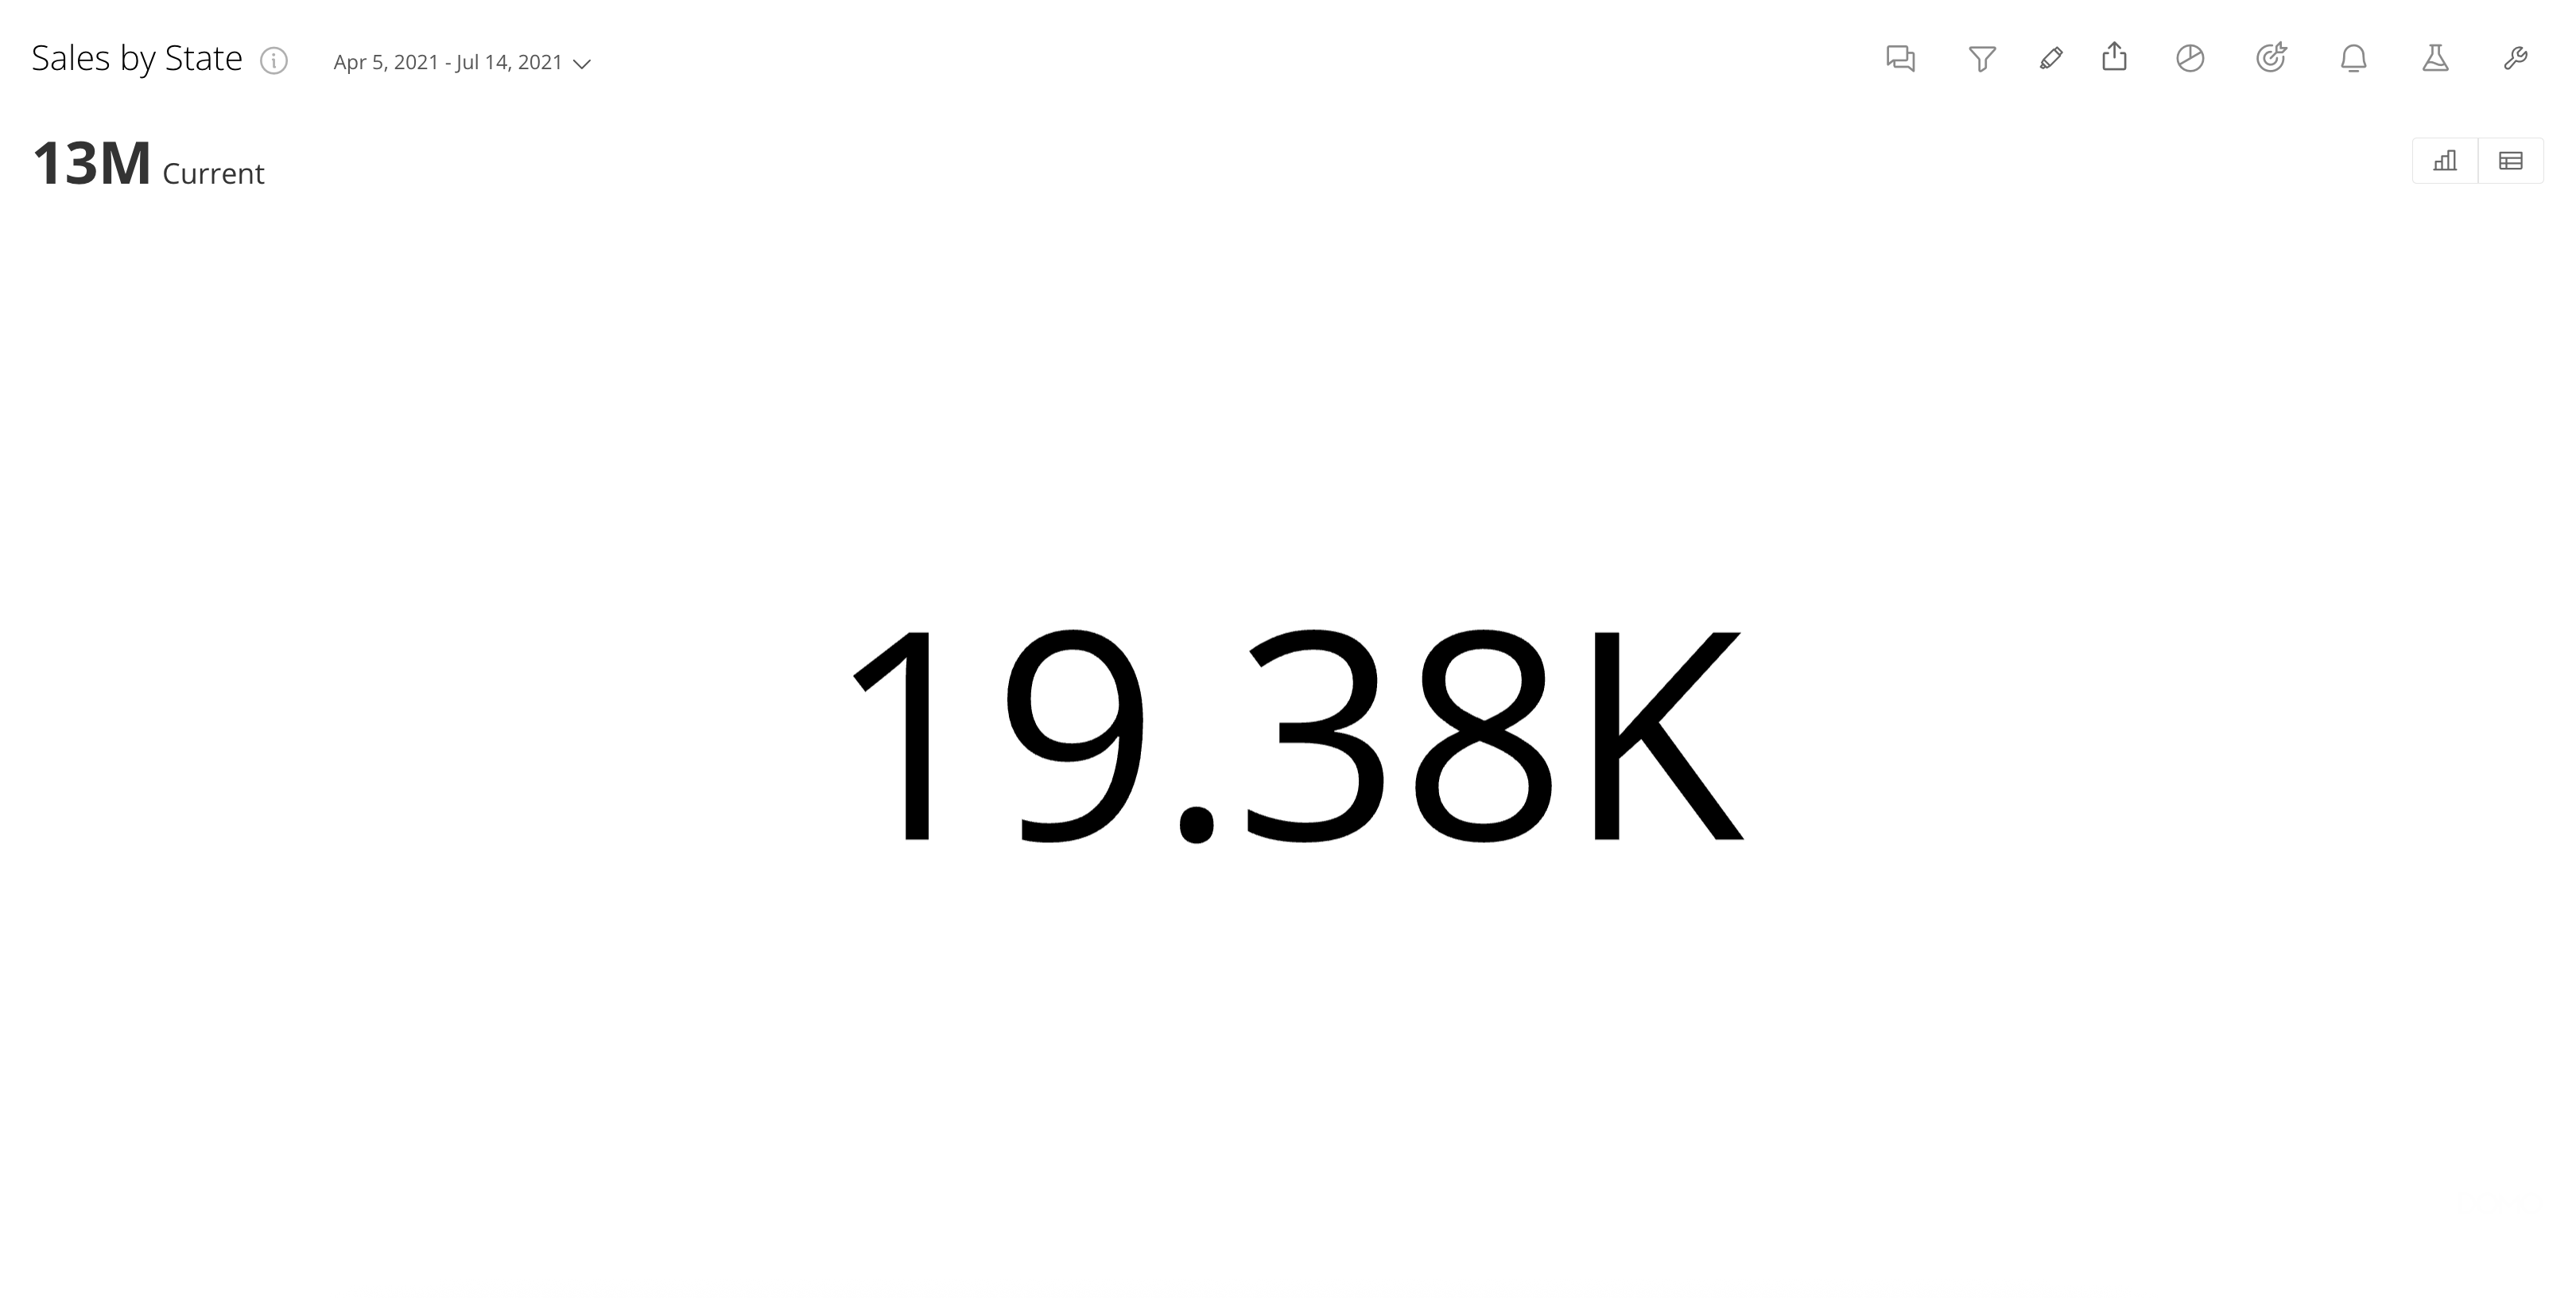
A gauge is a simple chart that indicates progress towards meeting a target. A Single Value Gauge displays the first value in your DataSet as a numeral. No other graphics or images are used, and there are no ranges. This chart type is useful when you want to see a single value quickly without having to interpret elements like bars or lines.

Learn more about [other gauges](/s/article/360042924334) in Domo.

<Frame>
  <img alt="" src="https://mintcdn.com/domoinc-openapi-sync-dataflows/J3x-O8qWbl7BB1F9/images/kb/ka0Vq000000EB3d-00N5w00000Ri7BU-0EMVq000007ru1e.jpg?fit=max&auto=format&n=J3x-O8qWbl7BB1F9&q=85&s=d2362e58595a827c1813863c42a2f4cf" style={{width: 900, height: 453}} width="3240" height="1632" data-path="images/kb/ka0Vq000000EB3d-00N5w00000Ri7BU-0EMVq000007ru1e.jpg" />
</Frame>

***

### Power a Single Value Gauge

A Single Value gauge requires only two columns or rows of data from your DataSet—one contains categories, and the other contains the values. For information about value, category, and series data, see [Understanding Chart Data](/s/article/360043428693 "Understanding Chart Data").

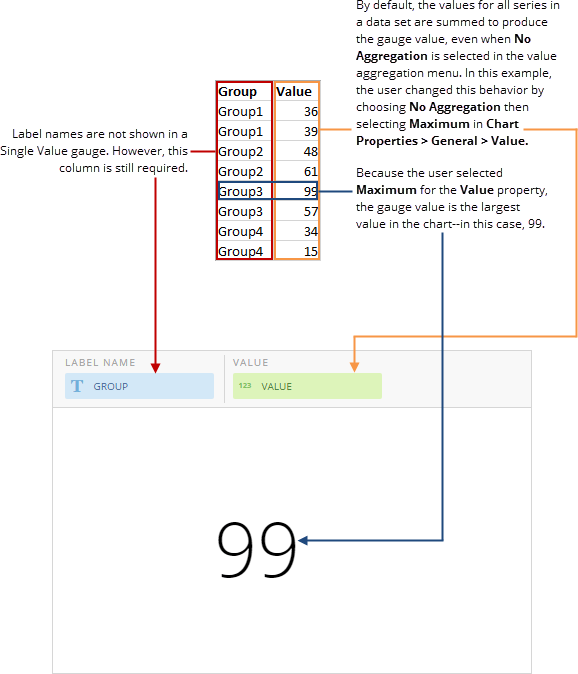
By default, all of the values in your values column are summed to produce the final value for the chart, even when you select **No Aggregation** in the value aggregation menu. This is because the **General > Value** chart property for this chart type is set to **Sum** by default. This property performs a second aggregation on the chart value *in addition* to the one selected in the value aggregation menu.
<Note>
  **Note:** Because having two aggregations in a chart is usually undesirable, select **No Aggregation** in the value aggregation menu, then select your desired aggregation in the **General > Value** menu under **Chart Properties**.
</Note>

The following graphic shows you how the data from the category and value columns in a typical column-based spreadsheet is converted into a Single Value gauge:

<Frame>
  <img alt="" src="https://mintcdn.com/domoinc-openapi-sync-dataflows/gDOtiCXH_3EtosfI/images/kb/ka0Vq0000000Jls-00N5w00000Ri7BU-0EM5w000005vP7a.png?fit=max&auto=format&n=gDOtiCXH_3EtosfI&q=85&s=cc666619baef28d0545e14d020efcced" style={{width: 578, height: 674}} width="578" height="674" data-path="images/kb/ka0Vq0000000Jls-00N5w00000Ri7BU-0EM5w000005vP7a.png" />
</Frame>

### Unique Properties — Single Value Gauge

You can customize the appearance of a Single Value gauge by editing its chart properties. This table describes the properties unique to Single Value gauges. For information about other available properties, see [Properties for Gauges](/s/article/360042925354 "Chart Properties").

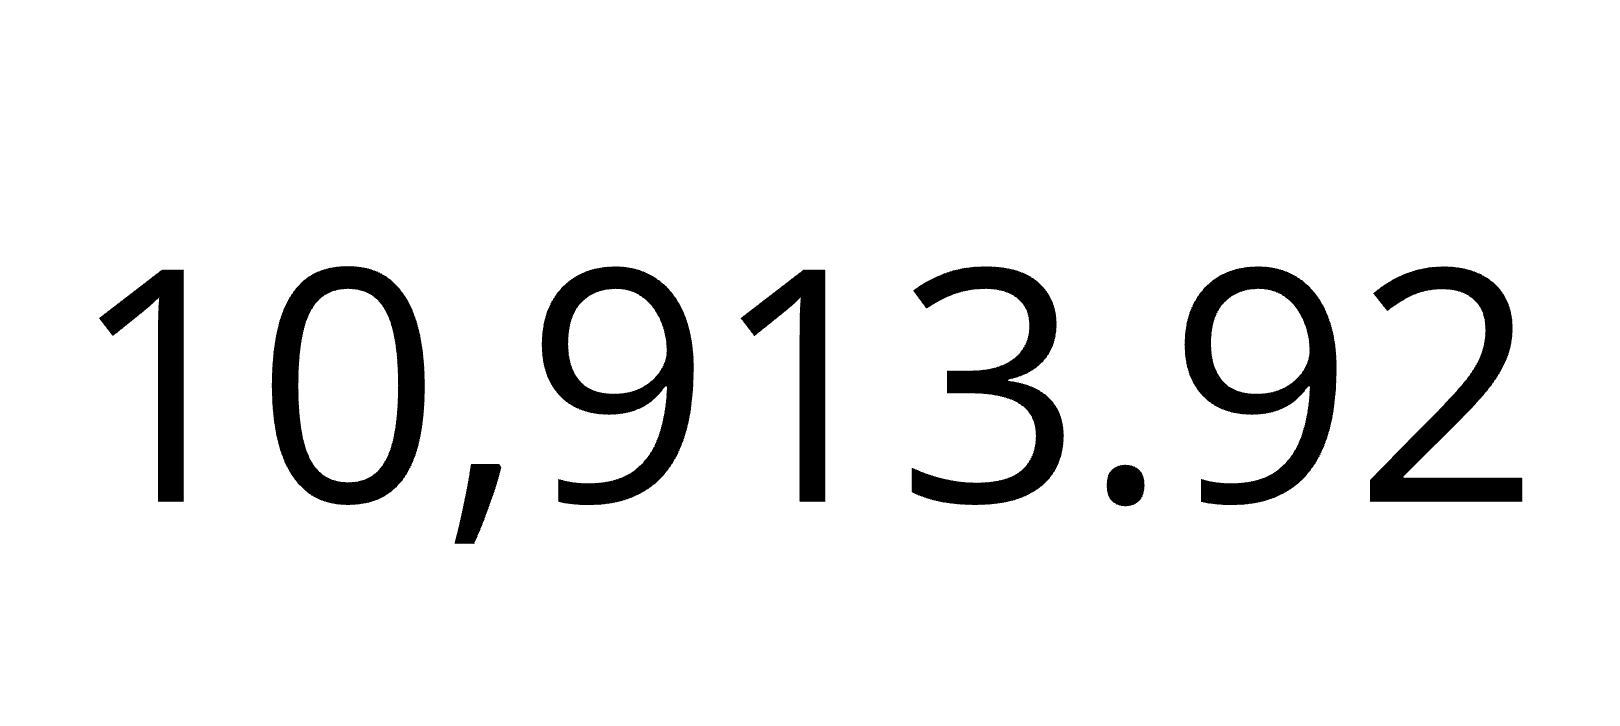
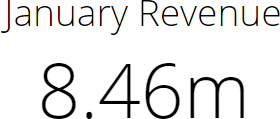
<table border="1" cellpadding="1" cellspacing="1" data-aura-rendered-by="33:209;a"><thead><tr><th colspan="1" rowspan="1"><p> Property </p></th><th colspan="1" rowspan="1"><p> Description </p></th><th colspan="1" rowspan="1"><p> Example </p></th></tr></thead><tbody><tr><td colspan="1" rowspan="1"><p><b> General </b> > <b> Divide value by </b></p></td><td colspan="1" rowspan="1"><p> Refers to the number that the gauge value is to be divided by, if any. This option is useful when the value is very large and you want to abbreviate it by dividing by a common number. For example, if the gauge value represented millions of dollars, you could choose to divide by millions—the gauge value would then be reduced to more comprehensible single digits. When you choose to divide by <b> Percentage </b>, the gauge value is multiplied by 100. </p><p /><div class="mdx-embed"><Warning><p><b> Troubleshooting abbreviations: </b> Don't want to automatically abbreviate your number? Choose <b> General </b> > <b> Divide value by </b> > <b> None </b>. </p></Warning></div></td><td colspan="1" rowspan="1"><p><img alt="" src="https://mintcdn.com/domoinc-openapi-sync-dataflows/J3x-O8qWbl7BB1F9/images/kb/ka0Vq000000EB3d-00N5w00000Ri7BU-0EMVq000007fMa1.jpg?fit=max&auto=format&n=J3x-O8qWbl7BB1F9&q=85&s=189e8b016f2baec6ef11d071910bfd8c" style={{width: 400, height: 179}} width="1620" height="726" data-path="images/kb/ka0Vq000000EB3d-00N5w00000Ri7BU-0EMVq000007fMa1.jpg" /></p></td></tr><tr><td colspan="1" rowspan="1"><p><b> General </b> > <b> Negative Numbers </b></p></td><td colspan="1" rowspan="1"><p> Determines the format for negative numbers. </p><p> If you select <b> -100 </b>, negative values have a minus symbol affixed. If you select <b> (100) </b>, negative values are enclosed in parentheses. </p></td><td colspan="1" rowspan="1"><p> — <br /></p></td></tr><tr><td colspan="1" rowspan="1"><p><b> General </b> > <b> Font size </b></p></td><td colspan="1" rowspan="1"><p> Determines the font size. The default is to scale the text to fit the space. </p></td><td colspan="1" rowspan="1"><p /></td></tr><tr><td colspan="1" rowspan="1"><p><b> General </b> > <b> Horizontal text alignment </b></p></td><td colspan="1" rowspan="1"><p> Sets the text to be center, left, or right aligned. The default is center. </p></td><td colspan="1" rowspan="1"><p /></td></tr><tr><td colspan="1" rowspan="1"><p><b> General </b> > <b> Vertical text alignment </b></p></td><td colspan="1" rowspan="1"><p> Sets the text to be middle, top, or bottom aligned. The default is middle. </p></td><td colspan="1" rowspan="1"><p /></td></tr><tr><td colspan="1" rowspan="1"><p><b> General </b> > <b> Top margin </b></p></td><td colspan="1" rowspan="1"><p> Sets the amount of space above the text in pixels. </p></td><td colspan="1" rowspan="1"><p /></td></tr><tr><td colspan="1" rowspan="1"><p><b> General </b> > <b> Left margin </b></p></td><td colspan="1" rowspan="1"><p> Sets the amount of space to the left of the text in pixels. </p></td><td colspan="1" rowspan="1"><p /></td></tr><tr><td colspan="1" rowspan="1"><p><b> General </b> > <b> Bottom margin </b></p></td><td colspan="1" rowspan="1"><p> Sets the amount of space below the text in pixels. </p></td><td colspan="1" rowspan="1"><p /></td></tr><tr><td colspan="1" rowspan="1"><p><b> General </b> > <b> Right margin </b></p></td><td colspan="1" rowspan="1"><p> Sets the amount of space to the right of the text in pixels. </p></td><td colspan="1" rowspan="1"><p /></td></tr><tr><td colspan="1" rowspan="1"><p><b> Header/Footer </b> > <b> Header </b></p></td><td colspan="1" rowspan="1"><p> Specifies text to appear before the value. </p></td><td colspan="1" rowspan="1"><p><a target="_blank" title="/@api/deki/files/533/gauge_header.png"><img alt="" src="https://mintcdn.com/domoinc-openapi-sync-dataflows/DfXQTn5UA-Ig8rT5/images/kb/ka05w000001242k-00N5w00000Ri7BU-0EM5w000005vZ6U.png?fit=max&auto=format&n=DfXQTn5UA-Ig8rT5&q=85&s=adeee5a30b797f33bfe49b52784bf0db" style={{width: 383, height: 163}} width="280" height="119" data-path="images/kb/ka05w000001242k-00N5w00000Ri7BU-0EM5w000005vZ6U.png" /></a></p></td></tr><tr><td colspan="1" rowspan="1"><p><b> Header/Footer </b> > <b> Footer </b></p></td><td colspan="1" rowspan="1"><p> Specifies text to appear after the value. </p></td><td colspan="1" rowspan="1"><p><a target="_blank" title="/@api/deki/files/530/gauge_footer.png"><img alt="" src="https://mintcdn.com/domoinc-openapi-sync-dataflows/DfXQTn5UA-Ig8rT5/images/kb/ka05w000001242k-00N5w00000Ri7BU-0EM5w000005vZ6R.png?fit=max&auto=format&n=DfXQTn5UA-Ig8rT5&q=85&s=93815f614957bef2d4248add282897f1" style={{width: 455, height: 159}} width="369" height="129" data-path="images/kb/ka05w000001242k-00N5w00000Ri7BU-0EM5w000005vZ6R.png" /></a></p></td></tr><tr><td colspan="1" rowspan="1"><p><b> Colors </b></p></td><td colspan="1" rowspan="1"><p> Sets color rules for each column in the chart. </p></td><td colspan="1" rowspan="1"><p /></td></tr></tbody></table>

<Tip>
  **Tip:** Learn more about [chart properties](/s/article/360042925334).
</Tip>
