 Learn how to [create a Magic ETL DataFlow](/s/article/360055259234 "Creating a Magic ETL DataFlow").
***
### Group By Tile
Learn how to [create a Magic ETL DataFlow](/s/article/360055259234 "Creating a Magic ETL DataFlow").
***
### Group By Tile
 The Group By tile lets you aggregate values from multiple columns of data into one column. For example, you could calculate the average sales per product or find the number of yellow shirts in stock.
# Configure Group By Tile
Follow these steps to configure the Group By tile:
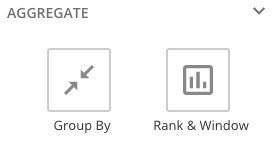
1. Inside Magic ETL, drag a **Group By** tile to the canvas from the **Aggregate** section in the left panel and connect it to your DataFlow.
The tile editor opens below the canvas.
The Group By tile lets you aggregate values from multiple columns of data into one column. For example, you could calculate the average sales per product or find the number of yellow shirts in stock.
# Configure Group By Tile
Follow these steps to configure the Group By tile:
1. Inside Magic ETL, drag a **Group By** tile to the canvas from the **Aggregate** section in the left panel and connect it to your DataFlow.
The tile editor opens below the canvas.
 2. (Optional) Rename the tile by selecting
 4. Enter a name for the new aggregated column.
5. Define how to aggregate the new column. Learn about the
[aggregation types](#aggregation_types) below.
6. (Optional) You can choose to add another new column or add a formula.
1. If you choose to add a new column, repeat steps 4–5.
2. If you choose to add a formula, you can enter the formula or choose **Open the formula editor** to use the AI SQL Assistant to create your formula. Validate your formula and save and close to return to the canvas.
4. Enter a name for the new aggregated column.
5. Define how to aggregate the new column. Learn about the
[aggregation types](#aggregation_types) below.
6. (Optional) You can choose to add another new column or add a formula.
1. If you choose to add a new column, repeat steps 4–5.
2. If you choose to add a formula, you can enter the formula or choose **Open the formula editor** to use the AI SQL Assistant to create your formula. Validate your formula and save and close to return to the canvas.
 The Rank & Window tile lets you create new columns by applying any of several rank and window functions to columns. For all of these actions, you first define your function, then specify the column the function is to be ordered by, and finally indicate whether the results in the new column should be in ascending or descending order.
Rank & Window functions are categorized into three types: Ranking, Framed, and Offset.
For more information about all of the functions described in this section, see the [AWS docs](http://docs.aws.amazon.com/redshift/latest/dg/c_Window_functions.html)
The Rank & Window tile lets you create new columns by applying any of several rank and window functions to columns. For all of these actions, you first define your function, then specify the column the function is to be ordered by, and finally indicate whether the results in the new column should be in ascending or descending order.
Rank & Window functions are categorized into three types: Ranking, Framed, and Offset.
For more information about all of the functions described in this section, see the [AWS docs](http://docs.aws.amazon.com/redshift/latest/dg/c_Window_functions.html) 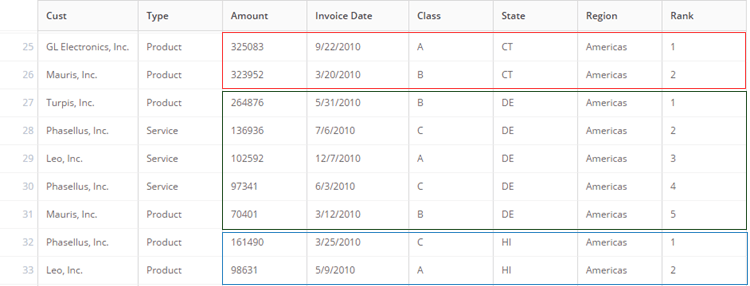 Note that the two amounts for Connecticut ("CT") are ranked first, followed by the five amounts for Delaware ("DE"), and so on.
# Ranking Functions
Ranking functions derive a ranking number for each value in a selected column and display it in a new column. There are three available ranking functions: [Rank](#rank), [Dense Rank](#dense_rank), and [Row Number](#row_number).
#### Rank
The Rank function assigns a rank number to each value in the selected column. If any cells in the column contain the same value, those cells are given the same ranking number, and a "gap" appears in the numbering depending on how many numbers were skipped. For example, if the first three cells in the column had a value of 100 and the next cell had a value of 200 with the values sorted in ascending order, the first three cells would be ranked "1" and the fourth cell would be ranked "4."
The following screenshot shows an example of this:
Note that the two amounts for Connecticut ("CT") are ranked first, followed by the five amounts for Delaware ("DE"), and so on.
# Ranking Functions
Ranking functions derive a ranking number for each value in a selected column and display it in a new column. There are three available ranking functions: [Rank](#rank), [Dense Rank](#dense_rank), and [Row Number](#row_number).
#### Rank
The Rank function assigns a rank number to each value in the selected column. If any cells in the column contain the same value, those cells are given the same ranking number, and a "gap" appears in the numbering depending on how many numbers were skipped. For example, if the first three cells in the column had a value of 100 and the next cell had a value of 200 with the values sorted in ascending order, the first three cells would be ranked "1" and the fourth cell would be ranked "4."
The following screenshot shows an example of this:
 Because the first three states have the same `$ ` value, all are ranked as 1. Rank numbers 2 and 3 are then skipped. The next five states also have the same value, and are all ranked as 4, and so on.
Follow these steps to configure the Rank function:
1. Select the **Rank & Window** tile on the canvas to open the tile editor.
2. (Optional) At the top of the tile editor, rename the tile by selecting
Because the first three states have the same `$ ` value, all are ranked as 1. Rank numbers 2 and 3 are then skipped. The next five states also have the same value, and are all ranked as 4, and so on.
Follow these steps to configure the Rank function:
1. Select the **Rank & Window** tile on the canvas to open the tile editor.
2. (Optional) At the top of the tile editor, rename the tile by selecting
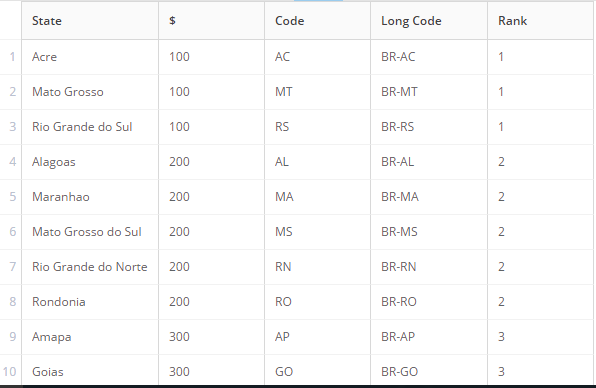 Because the first three states have the same `$` value, all are ranked as 1. The next five states also have the same `$` value and are ranked as 2, and so on.
Follow these steps to configure the Dense Rank function:
1. Select the **Rank & Window** tile on the canvas to open the tile editor.
2. (Optional) At the top of the tile editor, rename the tile by selecting
Because the first three states have the same `$` value, all are ranked as 1. The next five states also have the same `$` value and are ranked as 2, and so on.
Follow these steps to configure the Dense Rank function:
1. Select the **Rank & Window** tile on the canvas to open the tile editor.
2. (Optional) At the top of the tile editor, rename the tile by selecting
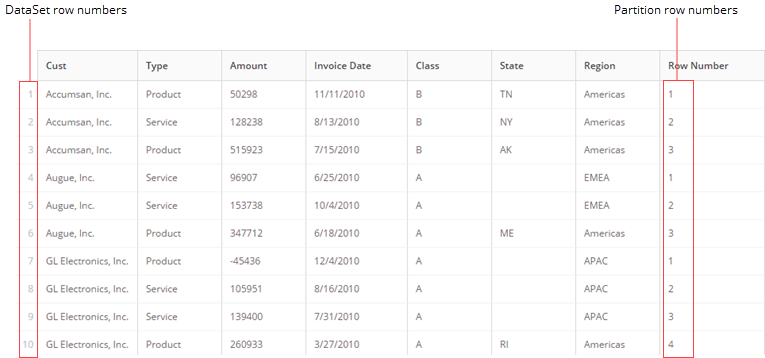 Follow these steps to configure the Row Numbers function:
1. Select the **Rank & Window** tile on the canvas to open the tile editor.
2. (Optional) At the top of the tile editor, rename the tile by selecting
Follow these steps to configure the Row Numbers function:
1. Select the **Rank & Window** tile on the canvas to open the tile editor.
2. (Optional) At the top of the tile editor, rename the tile by selecting
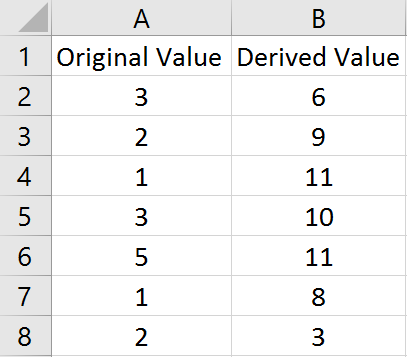 In the example, each value in the `Original Value` column is added to the one cell above it and the two cells below it, and the result appears in the same row in the `Derived Value` column. So for row 5, 3 is added to 1 (in row 4), 5 (in row 6), and 1 (in row 7). The total—10—appears in the `Derived Value` column in row 5. If there are not enough values above or below a given value to include in the calculation, these are omitted. For example, for row 7 there is only one Following value, so the equation simply becomes 5 + 1 + 2 = 8.
When partitioning is applied, partitions are honored in functions. In the following example, the user has selected Sum and indicated a Preceding value of 1 and a Following value of 2, just as in the previous example. However, they also designate the `Class` column as a partition.
In the example, each value in the `Original Value` column is added to the one cell above it and the two cells below it, and the result appears in the same row in the `Derived Value` column. So for row 5, 3 is added to 1 (in row 4), 5 (in row 6), and 1 (in row 7). The total—10—appears in the `Derived Value` column in row 5. If there are not enough values above or below a given value to include in the calculation, these are omitted. For example, for row 7 there is only one Following value, so the equation simply becomes 5 + 1 + 2 = 8.
When partitioning is applied, partitions are honored in functions. In the following example, the user has selected Sum and indicated a Preceding value of 1 and a Following value of 2, just as in the previous example. However, they also designate the `Class` column as a partition.
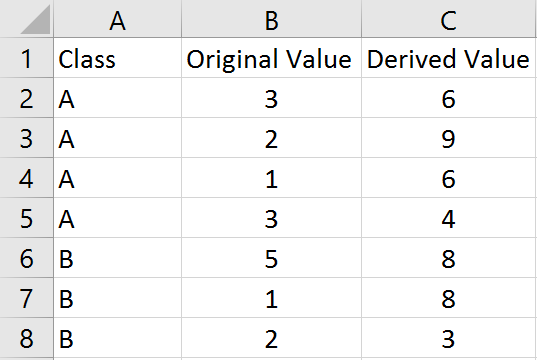 Because of the row grouping, due to the partition, some of the values are summed differently. For example, in row 4, only one Following value is available because the partition separates all "B" values into another group. So the equation for this row becomes 2 + 1 + 3 = 6. Likewise, for row 6, only the two Following values are available because of the partition; therefore, 5 + 1 + 2 = 8.
For an explanation of partitioning, see [Understanding Partitions](#h_8a2b5871-00dc-41c7-98c4-649d64420343 "ETL Actions: Rank and Window") at the top of this section.
#### Average
The Average function takes the average of a given cell and its indicated Preceding and Following values. In the following example, the user has applied the Average function to the `Amount` column, set Preceding and Following values of 2, and set the `Cust` column as a partition.
Because of the row grouping, due to the partition, some of the values are summed differently. For example, in row 4, only one Following value is available because the partition separates all "B" values into another group. So the equation for this row becomes 2 + 1 + 3 = 6. Likewise, for row 6, only the two Following values are available because of the partition; therefore, 5 + 1 + 2 = 8.
For an explanation of partitioning, see [Understanding Partitions](#h_8a2b5871-00dc-41c7-98c4-649d64420343 "ETL Actions: Rank and Window") at the top of this section.
#### Average
The Average function takes the average of a given cell and its indicated Preceding and Following values. In the following example, the user has applied the Average function to the `Amount` column, set Preceding and Following values of 2, and set the `Cust` column as a partition.
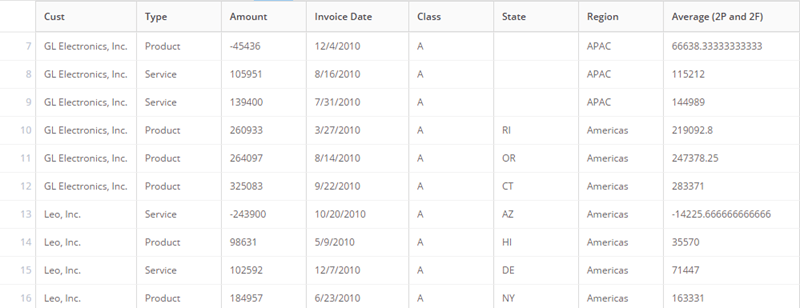 Follow these steps to configure the Average function:
1. Select the **Rank & Window** tile on the canvas to open the tile editor.
2. (Optional) At the top of the tile editor, rename the tile by selecting
Follow these steps to configure the Average function:
1. Select the **Rank & Window** tile on the canvas to open the tile editor.
2. (Optional) At the top of the tile editor, rename the tile by selecting
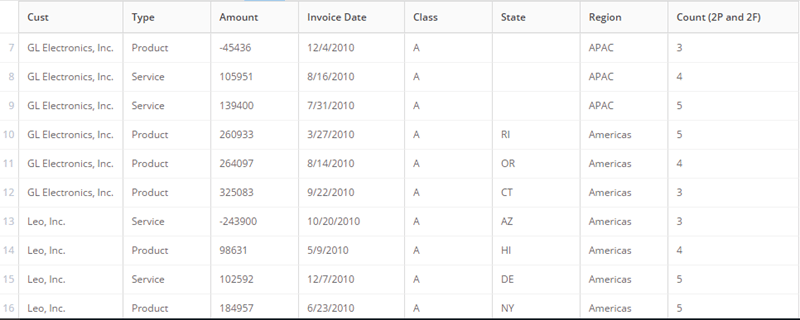 Follow these steps to configure the Count function:
1. Select the **Rank & Window** tile on the canvas to open the tile editor.
2. (Optional) At the top of the tile editor, rename the tile by selecting
Follow these steps to configure the Count function:
1. Select the **Rank & Window** tile on the canvas to open the tile editor.
2. (Optional) At the top of the tile editor, rename the tile by selecting
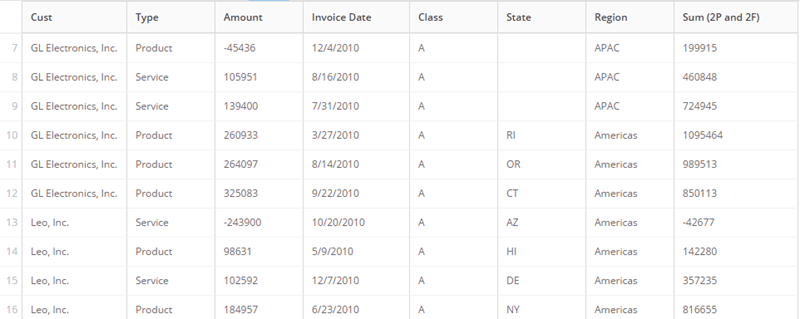 Follow these steps to configure the Sum function:
1. Select the **Rank & Window** tile on the canvas to open the tile editor.
2. (Optional) At the top of the tile editor, rename the tile by selecting
Follow these steps to configure the Sum function:
1. Select the **Rank & Window** tile on the canvas to open the tile editor.
2. (Optional) At the top of the tile editor, rename the tile by selecting
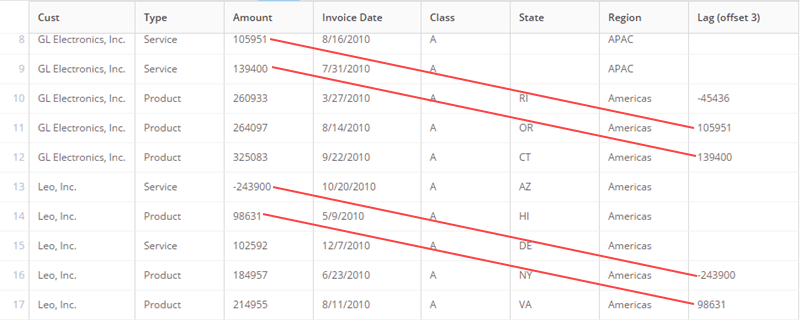 Note that an offset of 3 rows has been inserted between the values in the `Amount` column and the matching values in the `Lag` column. Also, because of the partition, rows 13 to 15 are the first 3 rows in the "Leo, Inc." grouping, so their cells in the `Lag` column appear blank.
Follow these steps to configure a Lag function:
1. Select the **Rank & Window** tile on the canvas to open the tile editor.
2. (Optional) At the top of the tile editor, rename the tile by selecting
Note that an offset of 3 rows has been inserted between the values in the `Amount` column and the matching values in the `Lag` column. Also, because of the partition, rows 13 to 15 are the first 3 rows in the "Leo, Inc." grouping, so their cells in the `Lag` column appear blank.
Follow these steps to configure a Lag function:
1. Select the **Rank & Window** tile on the canvas to open the tile editor.
2. (Optional) At the top of the tile editor, rename the tile by selecting
 4. Add a name for the new column containing the derived values. We suggest choosing a name that indicates the offset value of the lag.
5. In the **Select function type** menu, select **Lag**.
Two new menus appear after you select your function type.
6. In the **Select column** menu, select the column with values that will appear in the new column.
7. In the **What rows should be included** field, enter the desired offset value.
4. Add a name for the new column containing the derived values. We suggest choosing a name that indicates the offset value of the lag.
5. In the **Select function type** menu, select **Lag**.
Two new menus appear after you select your function type.
6. In the **Select column** menu, select the column with values that will appear in the new column.
7. In the **What rows should be included** field, enter the desired offset value.
 8. Select **Apply** in the top right corner of the tile editor.
Three new steps appear.
9. In Step 2 of the dialog, select the column you want your order to be based on.
10. In Step 3 of the dialog, select the order you want the values in the new column to be sorted in.
11. (Optional) In Step 4 of the dialog, select the column to use as a partition, if any. (For an explanation of partitioning, see
[Understanding Partitions](#h_8a2b5871-00dc-41c7-98c4-649d64420343 "ETL Actions: Rank and Window") at the top of this page.)
#### Lead
In a Lead function, the values in your new column precede the values in your original column after a specified offset. In the following example, a Lead of 3 has been applied, and the `Cust` column has been added as a partition.
8. Select **Apply** in the top right corner of the tile editor.
Three new steps appear.
9. In Step 2 of the dialog, select the column you want your order to be based on.
10. In Step 3 of the dialog, select the order you want the values in the new column to be sorted in.
11. (Optional) In Step 4 of the dialog, select the column to use as a partition, if any. (For an explanation of partitioning, see
[Understanding Partitions](#h_8a2b5871-00dc-41c7-98c4-649d64420343 "ETL Actions: Rank and Window") at the top of this page.)
#### Lead
In a Lead function, the values in your new column precede the values in your original column after a specified offset. In the following example, a Lead of 3 has been applied, and the `Cust` column has been added as a partition.
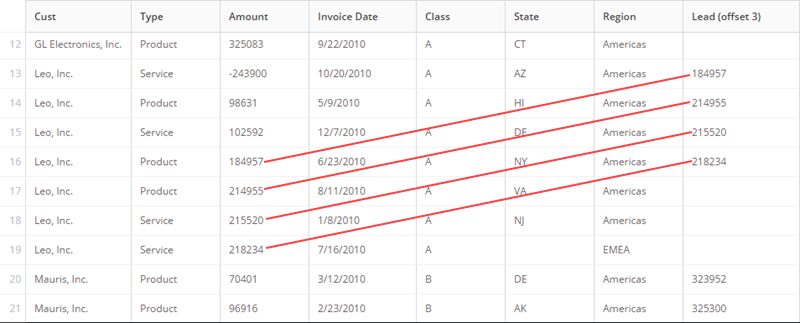 Notice that an offset of 3 rows has been inserted between the values in the `Amount` column and the matching values in the `Lead` column. Also, because of the partition, rows 17 to 19 are the last 3 rows in the "Leo, Inc." grouping, so their cells in the `Lead` column appear blank.
Follow these steps to configure a Lead function:
1. Select the **Rank & Window** tile on the canvas to open the tile editor.
2. (Optional) At the top of the tile editor, reame the tile by selecting
Notice that an offset of 3 rows has been inserted between the values in the `Amount` column and the matching values in the `Lead` column. Also, because of the partition, rows 17 to 19 are the last 3 rows in the "Leo, Inc." grouping, so their cells in the `Lead` column appear blank.
Follow these steps to configure a Lead function:
1. Select the **Rank & Window** tile on the canvas to open the tile editor.
2. (Optional) At the top of the tile editor, reame the tile by selecting