 ***
### General Information
This section provides information about all scripting tiles in Magic ETL. For information about specific tiles, use one of the following links to jump to the API reference for that tile:
* [Python Package API Reference](#python_api_reference "ETL Actions: Scripting")
* [R Package API Reference](#r_api_reference "Scripting Actions in ETL")
Scripting tiles are a powerful tool within Magic ETL. They allow you to write custom R or Python algorithms and implement them directly into DataFlows. Use them to create complex data science analyses that run every time your data updates.
# Take a Tour
All scripting tiles have the same look. The only difference between them is the supported language.
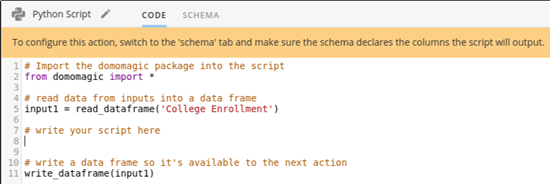
The main body of the tile is the code editor. This is where you write your script. It includes syntax highlighting for the specific language the tile supports.
***
### General Information
This section provides information about all scripting tiles in Magic ETL. For information about specific tiles, use one of the following links to jump to the API reference for that tile:
* [Python Package API Reference](#python_api_reference "ETL Actions: Scripting")
* [R Package API Reference](#r_api_reference "Scripting Actions in ETL")
Scripting tiles are a powerful tool within Magic ETL. They allow you to write custom R or Python algorithms and implement them directly into DataFlows. Use them to create complex data science analyses that run every time your data updates.
# Take a Tour
All scripting tiles have the same look. The only difference between them is the supported language.
The main body of the tile is the code editor. This is where you write your script. It includes syntax highlighting for the specific language the tile supports.
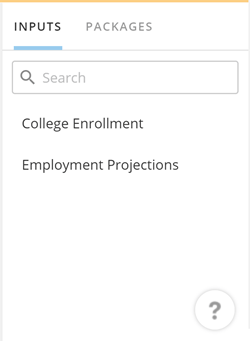
 On the right side of the tile is a searchable list of input tiles currently connected to the scripting tile. Click on the name of an input to inject a code snippet into the script at the location of the cursor. This code snippet will read the data into the script and store it in a variable. Rename the variable to whatever you would like.
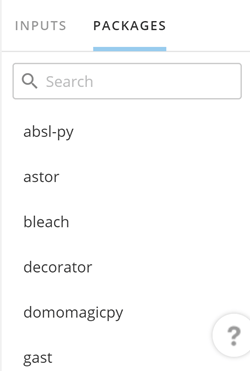
 There is a second tab on the right side of the tile called **Packages**. When you click the tab, a searchable list of available packages for the supported language is displayed. Hover over the package name for a description, or click on the arrow that appears to go to the package's documentation website. As with inputs, if you click on a package, a code snippet is injected into the script at the location of the cursor. This code snippet imports the selected library for use in the script.
 On the right side of the tile editor panel toolbar is a template icon button
 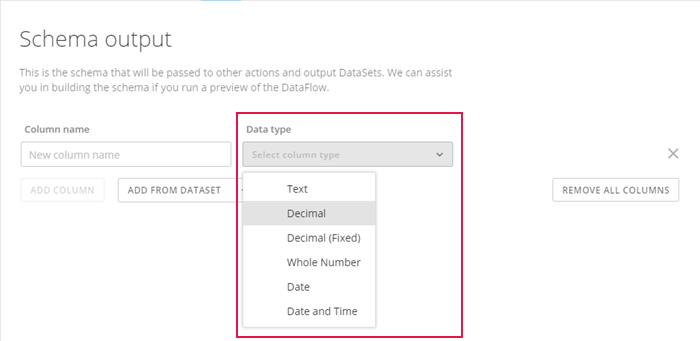 In the **Console** tab, you can see the standard out (`stdout` ) and standard error (`stderr` ) that your script produces. This tab is not available until after a preview is run on the tile, when it will appear as an option in the tile editor panel toolbar.
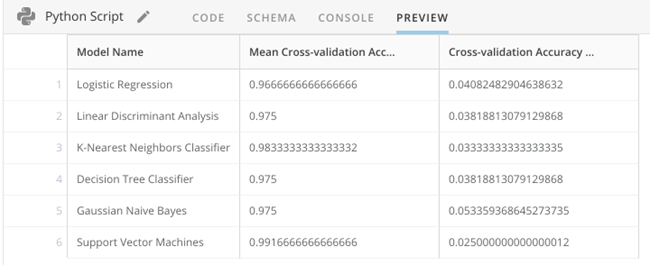
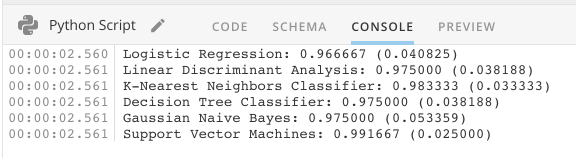 In the **Preview** tab, you can see the results of running your script. This tab also does not appear until after a preview is run. It will then appear as an option in the tile editor panel toolbar.
 # Get Data In and Out of the Scripting Tile
Domo provides a basic API for importing data (read) from the Domo ecosystem into your script and then for exporting your results out (writing) of the script and back into the Domo ecosystem. The API is different for each scripting language and tries to follow the semantics of the language.
# Get Data In and Out of the Scripting Tile
Domo provides a basic API for importing data (read) from the Domo ecosystem into your script and then for exporting your results out (writing) of the script and back into the Domo ecosystem. The API is different for each scripting language and tries to follow the semantics of the language.
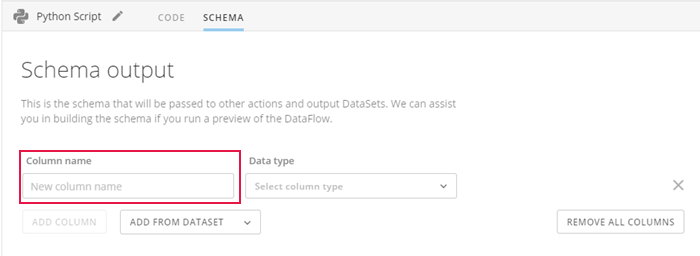 2. In the list of available data types, select the data type for this column.
 3. Add another column by clicking the
**Add Column button**.
3. Add another column by clicking the
**Add Column button**.
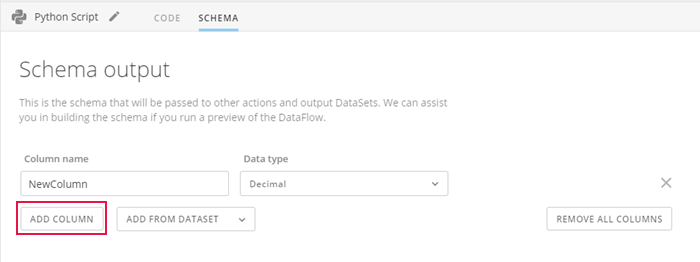
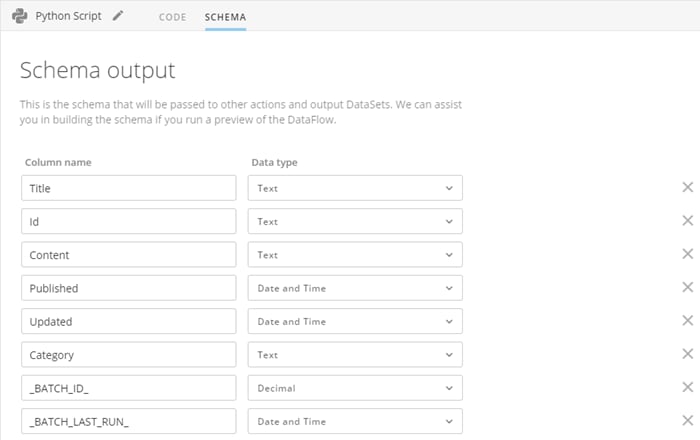
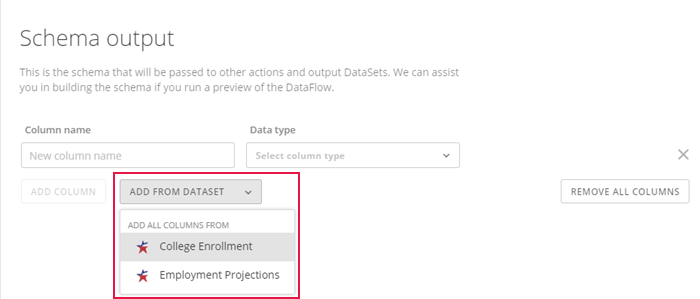 2. Remove any excess columns using the "X" button on the far right side of the column.
 #### Run Script
Follow these steps to have Domo run the script for you:
1. Click either the
#### Run Script
Follow these steps to have Domo run the script for you:
1. Click either the
 4. (Conditional) If the editor panel is not open at the bottom of the screen, click the Scripting tile you just added to the canvas so that it is selected; the editor panel will then open.
The code editor will be auto-populated with an initial code template. For more information on what is included in the template, see [Get Data In and Out of the Scripting Tile](#get_data_in_and_out "Scripting Actions in ETL"), above. A yellow banner also displays. Ignore this for now; it will be addressed later on in the configuration steps.
You will see that the template is pulling the data from the "Input DataSet" tile that is connected to the Scripting tile and storing it in a variable. This is the variable that your script should manipulate.
5. (Conditional) If you have multiple data sources, simply drag out another "Input DataSet," select the next DataSet you need, connect this tile to the Scripting tile, and add another import statement to the script.
4. (Conditional) If the editor panel is not open at the bottom of the screen, click the Scripting tile you just added to the canvas so that it is selected; the editor panel will then open.
The code editor will be auto-populated with an initial code template. For more information on what is included in the template, see [Get Data In and Out of the Scripting Tile](#get_data_in_and_out "Scripting Actions in ETL"), above. A yellow banner also displays. Ignore this for now; it will be addressed later on in the configuration steps.
You will see that the template is pulling the data from the "Input DataSet" tile that is connected to the Scripting tile and storing it in a variable. This is the variable that your script should manipulate.
5. (Conditional) If you have multiple data sources, simply drag out another "Input DataSet," select the next DataSet you need, connect this tile to the Scripting tile, and add another import statement to the script.
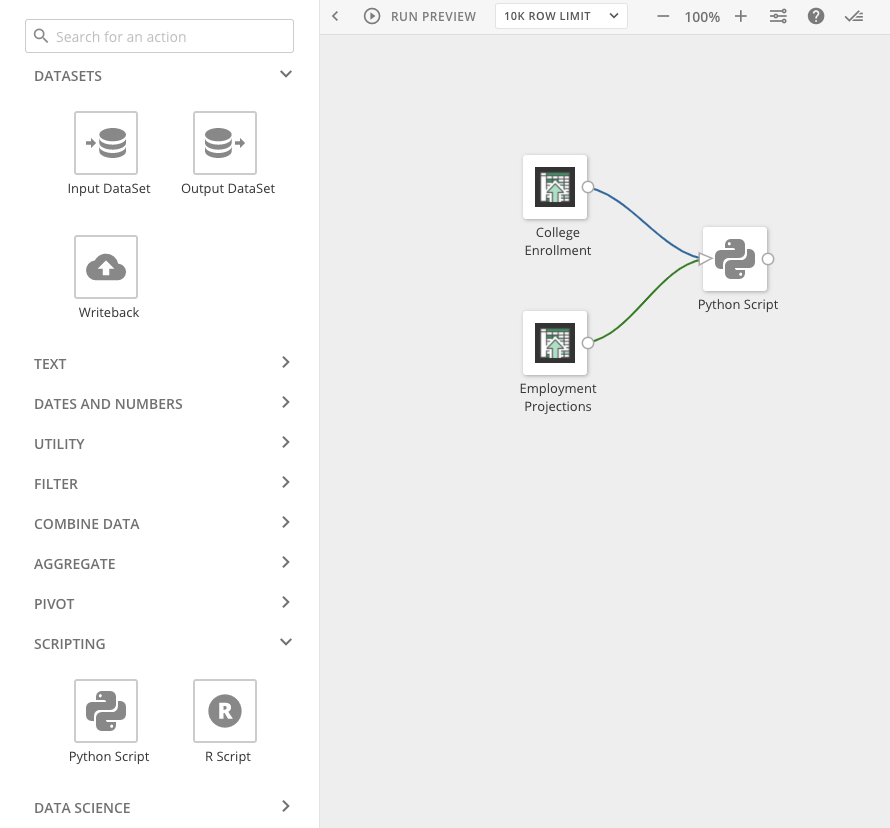 Underneath the line that is creating the variable to hold your data, you will see a space for you to write your script.
 6. Write your script in the line provided, making sure that the export statement at the very bottom of the template is exporting the variable that represents the final product of your script.
You will notice that your tile is still not marked as configured and there is still a yellow banner at the top of the tile telling you this. This is because the tile does not yet know what the result of your script looks like.
7. To provide the tile with this information...
1. Select the
**Schema** tab in the toolbar of the tile editor panel.
2. Choose one of the methods listed in the
[Populate the Resulting Schema](#populate_the_schema "Scripting Actions in ETL") section of this article and follow the steps there. Afterwards, continue the rest of the steps listed below.
8. Drag an "Output DataSet" tile from the sidebar and drop it onto the canvas.
9. Drag a connection from the Scripting tile to this new "Output DataSet" tile.
6. Write your script in the line provided, making sure that the export statement at the very bottom of the template is exporting the variable that represents the final product of your script.
You will notice that your tile is still not marked as configured and there is still a yellow banner at the top of the tile telling you this. This is because the tile does not yet know what the result of your script looks like.
7. To provide the tile with this information...
1. Select the
**Schema** tab in the toolbar of the tile editor panel.
2. Choose one of the methods listed in the
[Populate the Resulting Schema](#populate_the_schema "Scripting Actions in ETL") section of this article and follow the steps there. Afterwards, continue the rest of the steps listed below.
8. Drag an "Output DataSet" tile from the sidebar and drop it onto the canvas.
9. Drag a connection from the Scripting tile to this new "Output DataSet" tile.
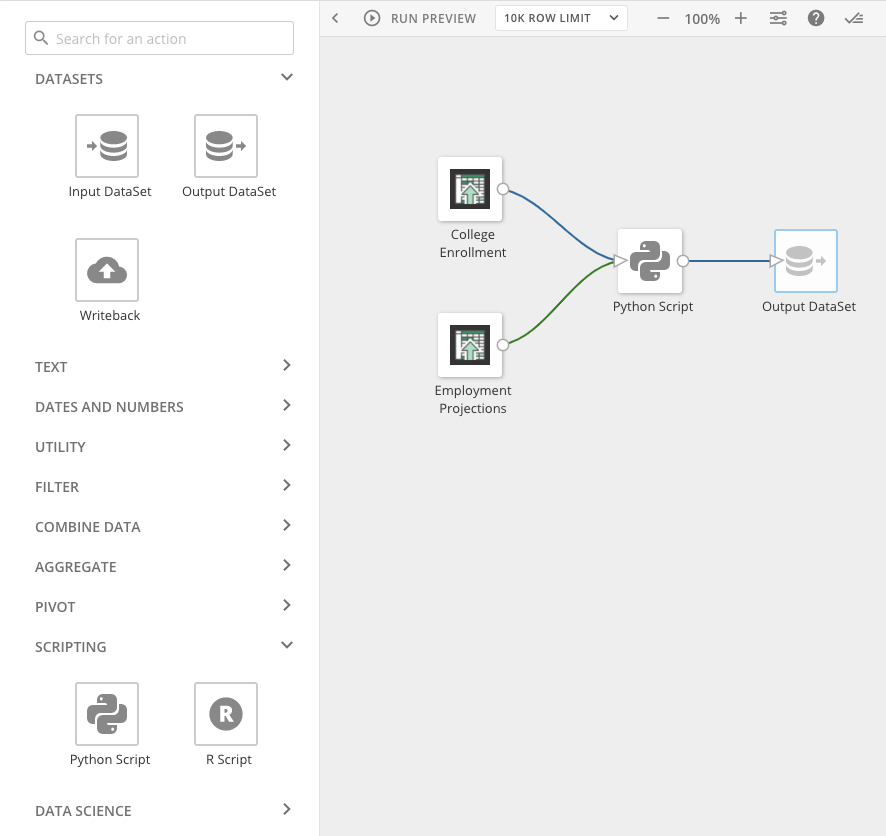 10. Select the Output DataSet tile to open the tile editor and give the tile a name and description.
The tiles within the DataFlow are now fully configured.
11. Next, enter a name for the DataFlow in the field in the top left corner.
12. Configure the settings in the panel using the
**Settings** button in the canvas toolbar.
13. Save the DataFlow.
Congratulations! You have created a DataFlow that utilizes a Scripting Tile. This is a basic configuration that only uses a single Input DataSet tile, a single Scripting tile, and a single Output DataSet tile. Don't forget that you can still use all of the classic DataFlow tiles to manipulate the data before and after your Scripting tile.
### API Reference
domomagic is the simple API provided to both the Magic ETL Python Tile and R Tile authors, allowing them to load and unload data to and from the Python and R contexts.
# Python Script Tile Module API Reference
10. Select the Output DataSet tile to open the tile editor and give the tile a name and description.
The tiles within the DataFlow are now fully configured.
11. Next, enter a name for the DataFlow in the field in the top left corner.
12. Configure the settings in the panel using the
**Settings** button in the canvas toolbar.
13. Save the DataFlow.
Congratulations! You have created a DataFlow that utilizes a Scripting Tile. This is a basic configuration that only uses a single Input DataSet tile, a single Scripting tile, and a single Output DataSet tile. Don't forget that you can still use all of the classic DataFlow tiles to manipulate the data before and after your Scripting tile.
### API Reference
domomagic is the simple API provided to both the Magic ETL Python Tile and R Tile authors, allowing them to load and unload data to and from the Python and R contexts.
# Python Script Tile Module API Reference


Method Signature | Parameters | Returns |
|---|---|---|
|
| The tiles input data.frame. |
|
| N/A |
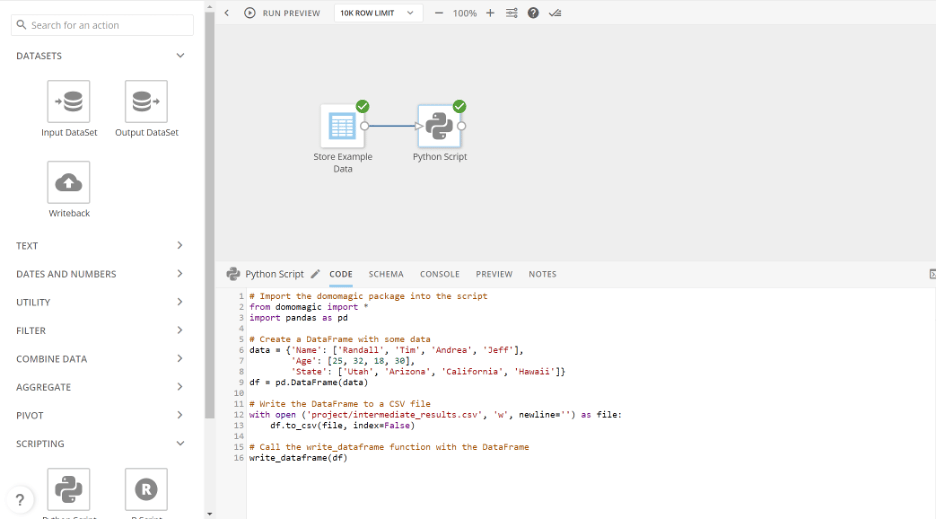 3. In another scripting tile, whether Python or R, read the intermediate results or models saved in the Project Directory from the previous tile and continue processing as needed.
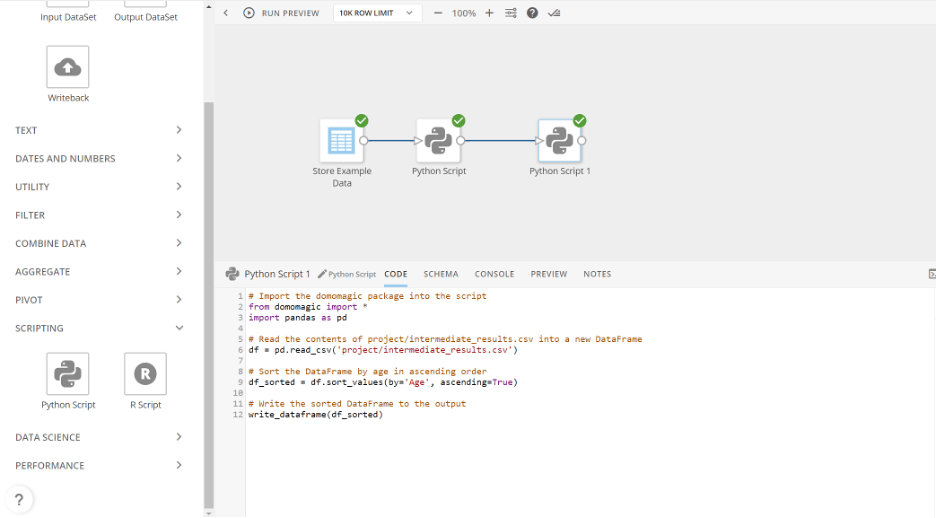 4. Save the final results or updated models to the Project Directory, if needed, and use the Output DataSet tile to store the final results.
### /tmp Directory
The /tmp directory is a shared space for all scripting tiles within a DataFlow. If you create a file in the /tmp Directory in one scripting tile, you can access it from another scripting tile within the same DataFlow. Unlike the Project Directory, the contents of the /tmp Directory are temporary and are deleted between executions of the DataFlow.
#### Use Cases
Possible use cases for the /tmp Directory include the following:
* **Use Case 1 —**
Create multiple output DataFrames in one script as files in /tmp and use them in separate tables in downstream scripting tiles.
* **Use Case 2 —**
Share an object between scripting tiles that can't be easily represented as a DataFrame.
* **Use Case 3 —**
Improve communication efficiency between scripting tiles.
Set Up a /tmp Directory
1. Create your DataFlow with the necessary scripting tiles, whether Python or R, and any required input and output DataSet tiles.
2. In the first scripting tile, write your script to process the data as needed and save the resulting data or objects to the /tmp Directory.
4. Save the final results or updated models to the Project Directory, if needed, and use the Output DataSet tile to store the final results.
### /tmp Directory
The /tmp directory is a shared space for all scripting tiles within a DataFlow. If you create a file in the /tmp Directory in one scripting tile, you can access it from another scripting tile within the same DataFlow. Unlike the Project Directory, the contents of the /tmp Directory are temporary and are deleted between executions of the DataFlow.
#### Use Cases
Possible use cases for the /tmp Directory include the following:
* **Use Case 1 —**
Create multiple output DataFrames in one script as files in /tmp and use them in separate tables in downstream scripting tiles.
* **Use Case 2 —**
Share an object between scripting tiles that can't be easily represented as a DataFrame.
* **Use Case 3 —**
Improve communication efficiency between scripting tiles.
Set Up a /tmp Directory
1. Create your DataFlow with the necessary scripting tiles, whether Python or R, and any required input and output DataSet tiles.
2. In the first scripting tile, write your script to process the data as needed and save the resulting data or objects to the /tmp Directory.
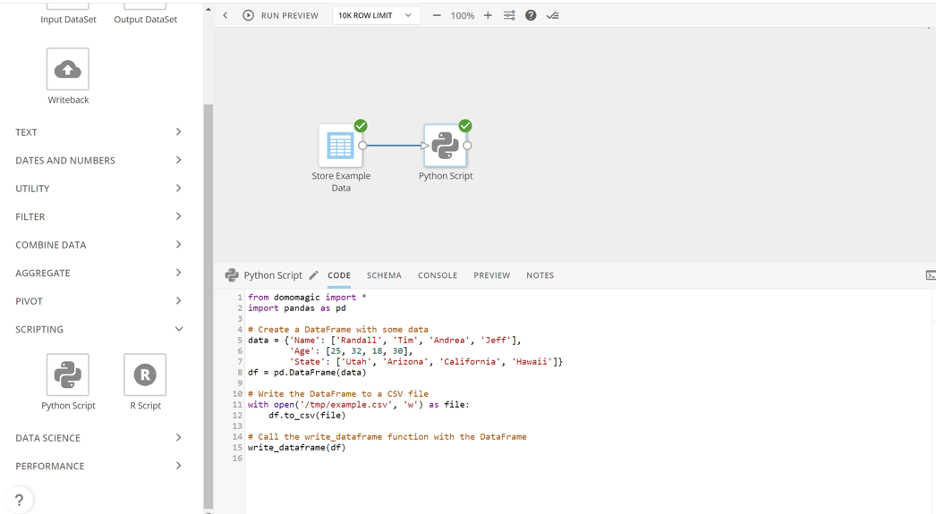 3. In the second scripting tile, read the data saved in the /tmp Directory from the previous tile.
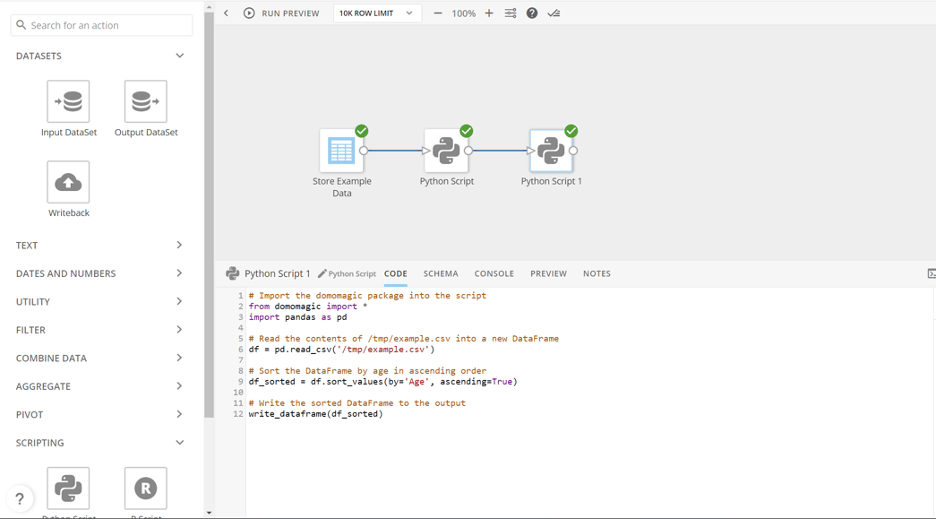 4. Continue processing the data as needed, and use the Output DataSet tile to save the final results.
### Troubleshooting
* If your tile is not marked as configured after writing the script, make sure you have provided a resulting schema. See
[Populate the Resulting Schema](#populate_the_schema "Scripting Actions in ETL") above to learn more.
* To get feedback on the behavior of your script, run a preview. You can run a preview by selecting the
**Preview** in the toolbar at the top of the canvas. After running a preview, a **Console** tab appears in the tile editor panel toolbar. This displays the standard out (`stdout` ) and standard error (`stderr` ) that your script produces. If the preview fails, check this console for errors.
* If a script is failing, check that you have properly finished all three of the steps listed in the
[Get Data In and Out of the Scripting Tile](#get_data_in_and_out "Scripting Actions in ETL") section of this article. Check the variable name that you are writing back to Domo to make sure it is correct.
* Previews run on only a sample of your DataSet. If your script requires a certain variability in data to function properly, the sample used by the preview might not meet this variability requirement. You can control the size of the preview sample by changing the
**Row Limit** in the canvas toolbar.
4. Continue processing the data as needed, and use the Output DataSet tile to save the final results.
### Troubleshooting
* If your tile is not marked as configured after writing the script, make sure you have provided a resulting schema. See
[Populate the Resulting Schema](#populate_the_schema "Scripting Actions in ETL") above to learn more.
* To get feedback on the behavior of your script, run a preview. You can run a preview by selecting the
**Preview** in the toolbar at the top of the canvas. After running a preview, a **Console** tab appears in the tile editor panel toolbar. This displays the standard out (`stdout` ) and standard error (`stderr` ) that your script produces. If the preview fails, check this console for errors.
* If a script is failing, check that you have properly finished all three of the steps listed in the
[Get Data In and Out of the Scripting Tile](#get_data_in_and_out "Scripting Actions in ETL") section of this article. Check the variable name that you are writing back to Domo to make sure it is correct.
* Previews run on only a sample of your DataSet. If your script requires a certain variability in data to function properly, the sample used by the preview might not meet this variability requirement. You can control the size of the preview sample by changing the
**Row Limit** in the canvas toolbar.