> ## Documentation Index
> Fetch the complete documentation index at: https://domoinc-openapi-sync-dataflows.mintlify.site/llms.txt
> Use this file to discover all available pages before exploring further.
# Create a Magic ETL DataFlow
export const InlineImage = ({src, alt = '', height = '1.6em'}) => {
return  ;
};
### Intro
Creating a Magic ETL DataFlow is simple with our intuitive drag-and-drop interface. Drag an input DataSet onto the canvas, then add tiles to specify how the DataSets should be joined and transformed. Tiles allow you to [aggregate](/s/article/360044876094), [combine data](/s/article/360044876194), perform [data science](/s/article/360045259294) operations, manipulate [DataSets](/s/article/360045402273), work with [dates and numbers](/s/article/360045402313), [filter](/s/article/360044876614), configure [column performance](/s/article/4405156517527), [pivot](/s/article/360044951294), [scripting](/s/article/360045485833), transform [text](/s/article/360045402873), and perform a number of [utility tasks](/s/article/360044876874) such as [adding constants](https://domo-support.domo.com/s/article/360044876874?language=en_US#add_constants) and [duplicating columns](https://domo-support.domo.com/s/article/360044876874?language=en_US#duplicate_column).
;
};
### Intro
Creating a Magic ETL DataFlow is simple with our intuitive drag-and-drop interface. Drag an input DataSet onto the canvas, then add tiles to specify how the DataSets should be joined and transformed. Tiles allow you to [aggregate](/s/article/360044876094), [combine data](/s/article/360044876194), perform [data science](/s/article/360045259294) operations, manipulate [DataSets](/s/article/360045402273), work with [dates and numbers](/s/article/360045402313), [filter](/s/article/360044876614), configure [column performance](/s/article/4405156517527), [pivot](/s/article/360044951294), [scripting](/s/article/360045485833), transform [text](/s/article/360045402873), and perform a number of [utility tasks](/s/article/360044876874) such as [adding constants](https://domo-support.domo.com/s/article/360044876874?language=en_US#add_constants) and [duplicating columns](https://domo-support.domo.com/s/article/360044876874?language=en_US#duplicate_column).
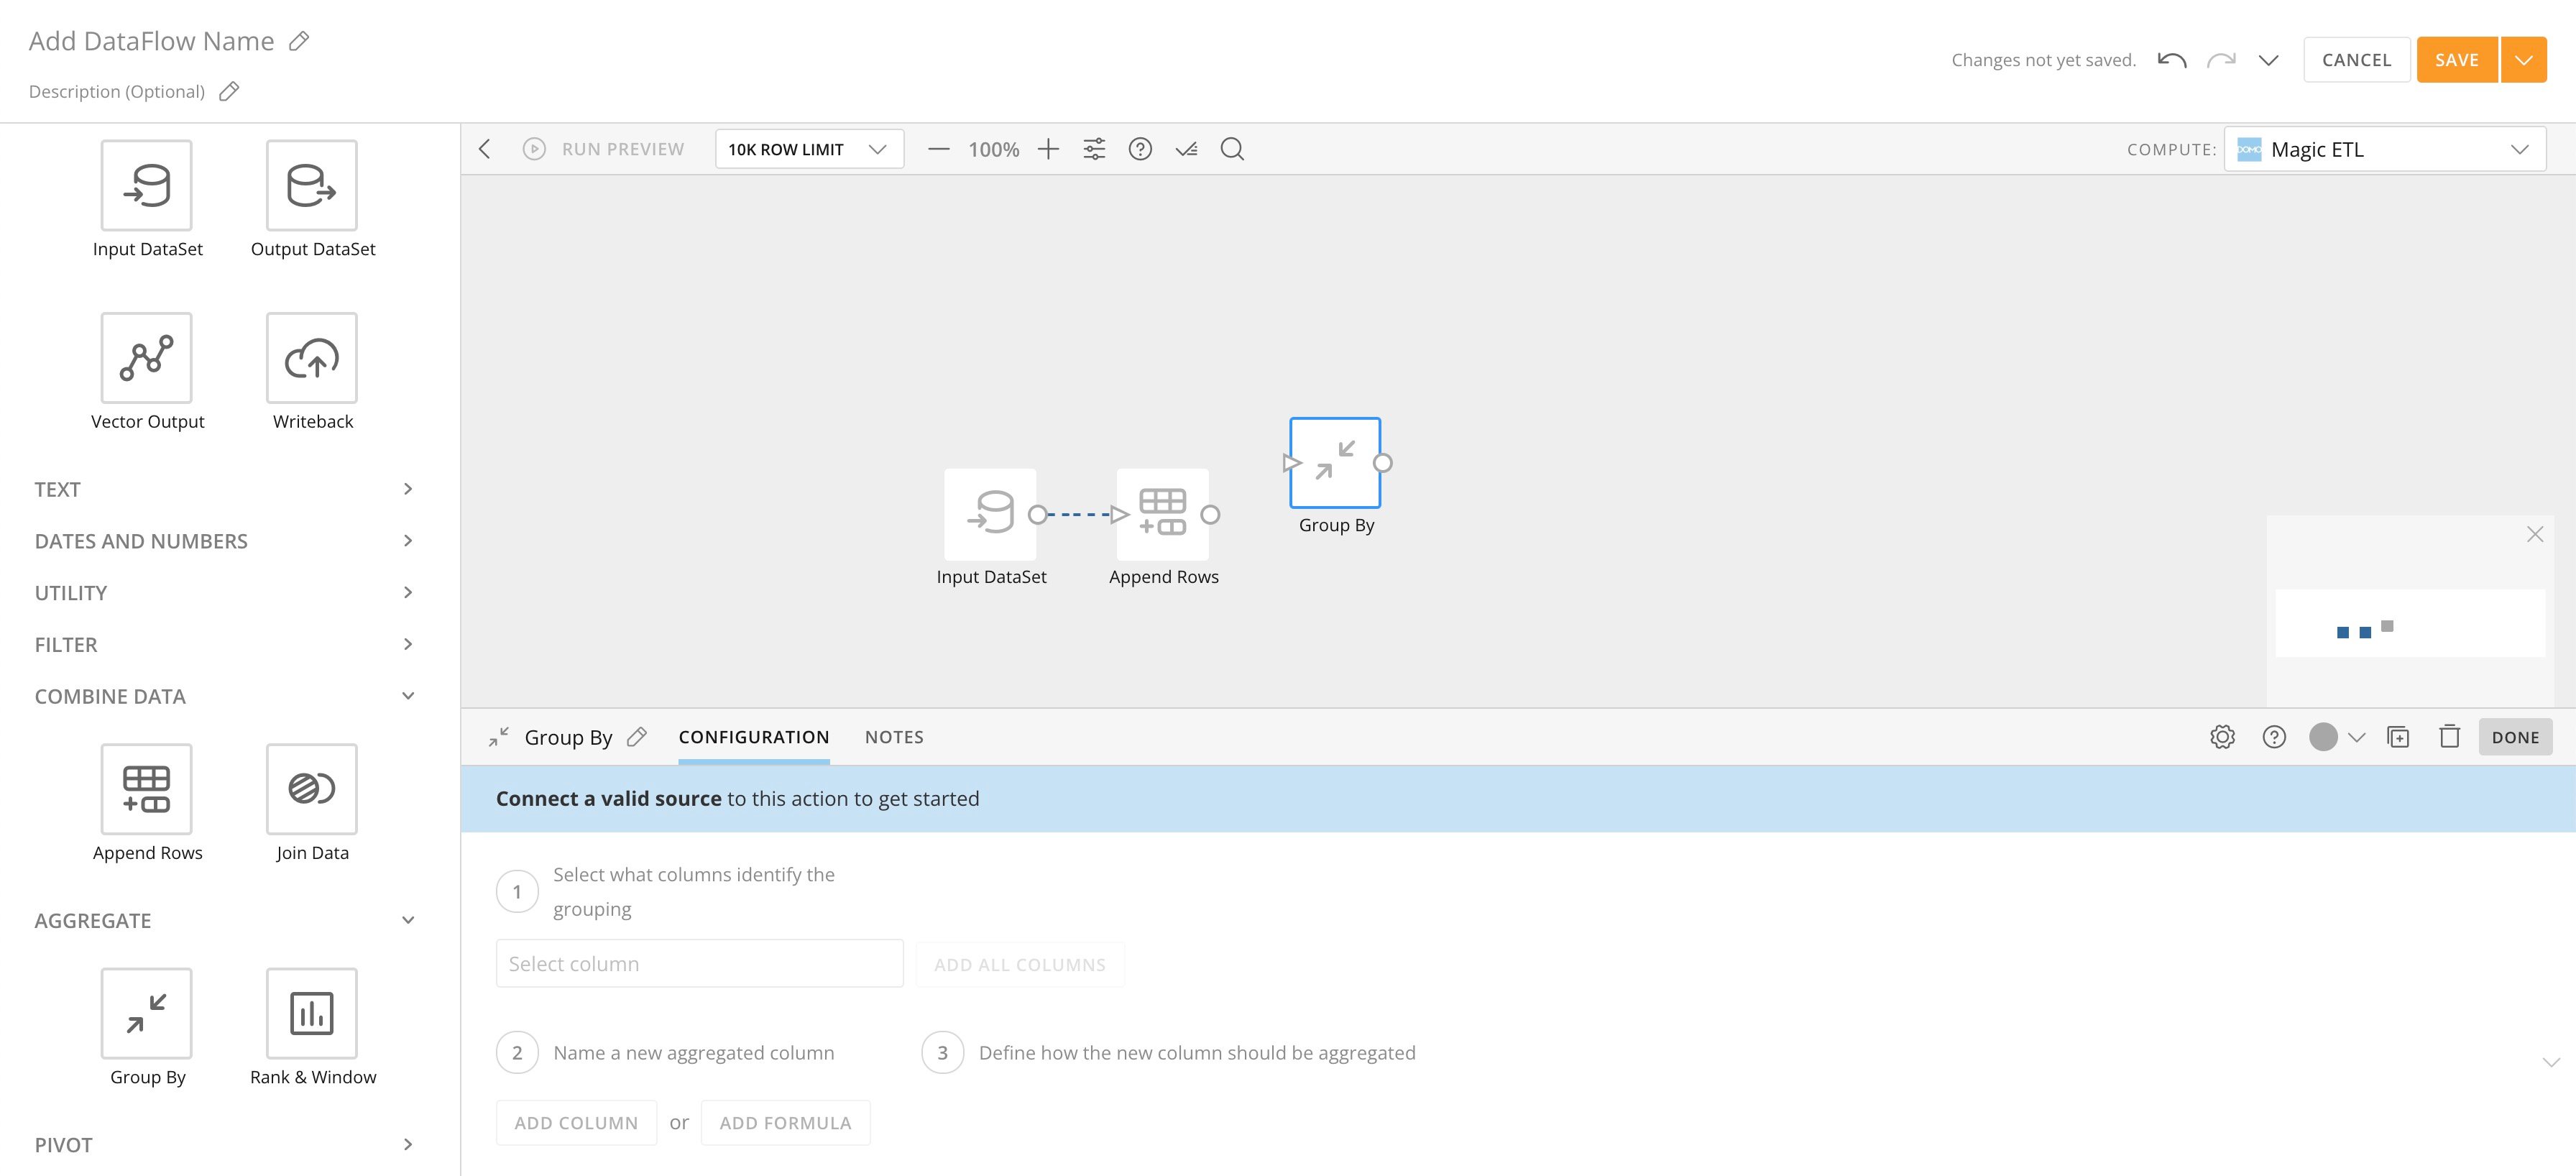 This article describes the basic steps to create a DataFlow in Magic ETL, including how to work with Personalized Data Permissions (PDP) and best practices.
***
### Magic ETL DataFlows and PDP
**Important:**
Input DataSets to a DataFlow cannot be restricted by PDP policies—all available rows
*must*
pass through the DataFlow. Because of this, you must apply any PDP policies to the output DataSets generated by a DataFlow.
When you build a DataFlow using an input DataSet with PDP policies in place, the DataFlow breaks unless at least one of the following criteria applies:
* You own the DataSet.
* You have an Admin system role or a custom role with the Manage DataFlow grant enabled. Learn about
[Managing Custom Roles](/s/article/360043438973)
.
* You are part of the DataSet's All Rows policy. Learn more about
[PDP and DataFlows](https://domo-support.domo.com/s/article/360042934614?language=en_US#pdp_and_dataflows "http://knowledge.domo.com?cid=pdpdatafusions")
.
### Magic ETL Canvas Tools
The Magic ETL canvas includes many tools to help you quickly create your DataFlow.
##### Coarser Grid
By default, the Magic ETL canvas has a fine-grained snap-to-grid of 12 pixels. You can modify this and choose a coarser snap-to-grid functionality of 32 pixels (half the size of a Magic ETL tile).
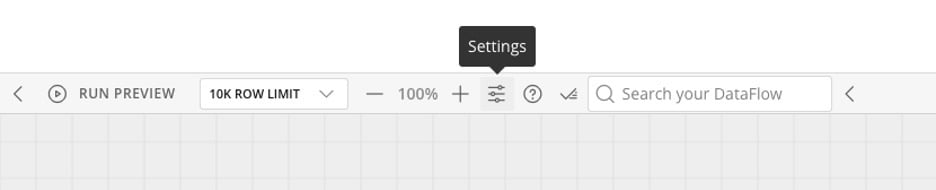
To enable the coarse grid, select **Settings** in the canvas toolbar to open the **DataFlow** **Settings** modal. **Note:** Changes to DataFlow Settings apply only to this DataFlow and do not persist across other DataFlows.
This article describes the basic steps to create a DataFlow in Magic ETL, including how to work with Personalized Data Permissions (PDP) and best practices.
***
### Magic ETL DataFlows and PDP
**Important:**
Input DataSets to a DataFlow cannot be restricted by PDP policies—all available rows
*must*
pass through the DataFlow. Because of this, you must apply any PDP policies to the output DataSets generated by a DataFlow.
When you build a DataFlow using an input DataSet with PDP policies in place, the DataFlow breaks unless at least one of the following criteria applies:
* You own the DataSet.
* You have an Admin system role or a custom role with the Manage DataFlow grant enabled. Learn about
[Managing Custom Roles](/s/article/360043438973)
.
* You are part of the DataSet's All Rows policy. Learn more about
[PDP and DataFlows](https://domo-support.domo.com/s/article/360042934614?language=en_US#pdp_and_dataflows "http://knowledge.domo.com?cid=pdpdatafusions")
.
### Magic ETL Canvas Tools
The Magic ETL canvas includes many tools to help you quickly create your DataFlow.
##### Coarser Grid
By default, the Magic ETL canvas has a fine-grained snap-to-grid of 12 pixels. You can modify this and choose a coarser snap-to-grid functionality of 32 pixels (half the size of a Magic ETL tile).
To enable the coarse grid, select **Settings** in the canvas toolbar to open the **DataFlow** **Settings** modal. **Note:** Changes to DataFlow Settings apply only to this DataFlow and do not persist across other DataFlows.
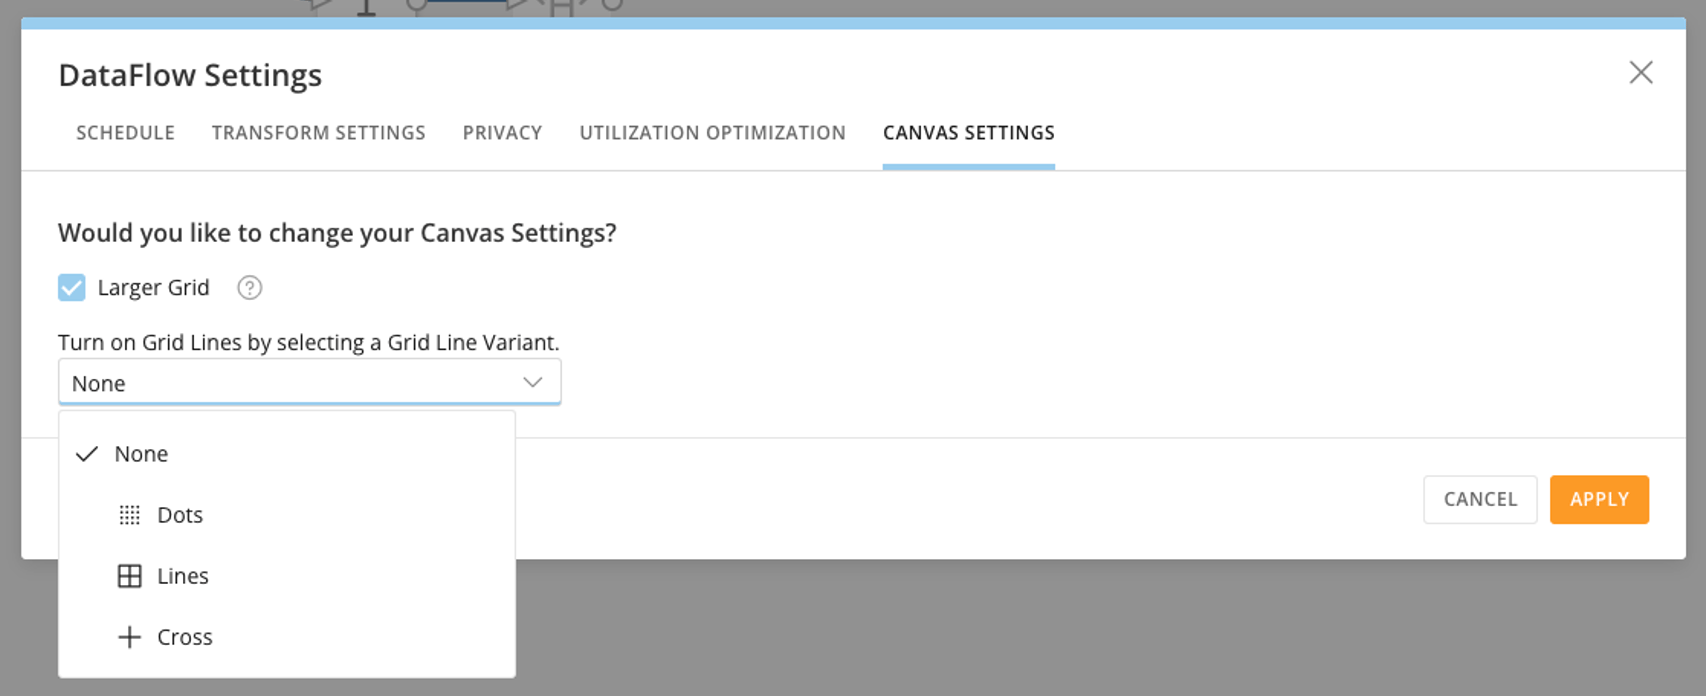
 Go to the **Canvas Settings** tab in the modal and check the box for **Larger Grid**. Choose the grid line style from the dropdown.
 ##### Mini Map
The mini map displays in the corner of the screen and helps you see the layout and navigate around complex and detailed DataFlows. Click and drag the white square in the mini map to move to a certain view of the DataFlow on the canvas.
##### Mini Map
The mini map displays in the corner of the screen and helps you see the layout and navigate around complex and detailed DataFlows. Click and drag the white square in the mini map to move to a certain view of the DataFlow on the canvas.
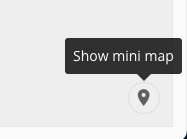
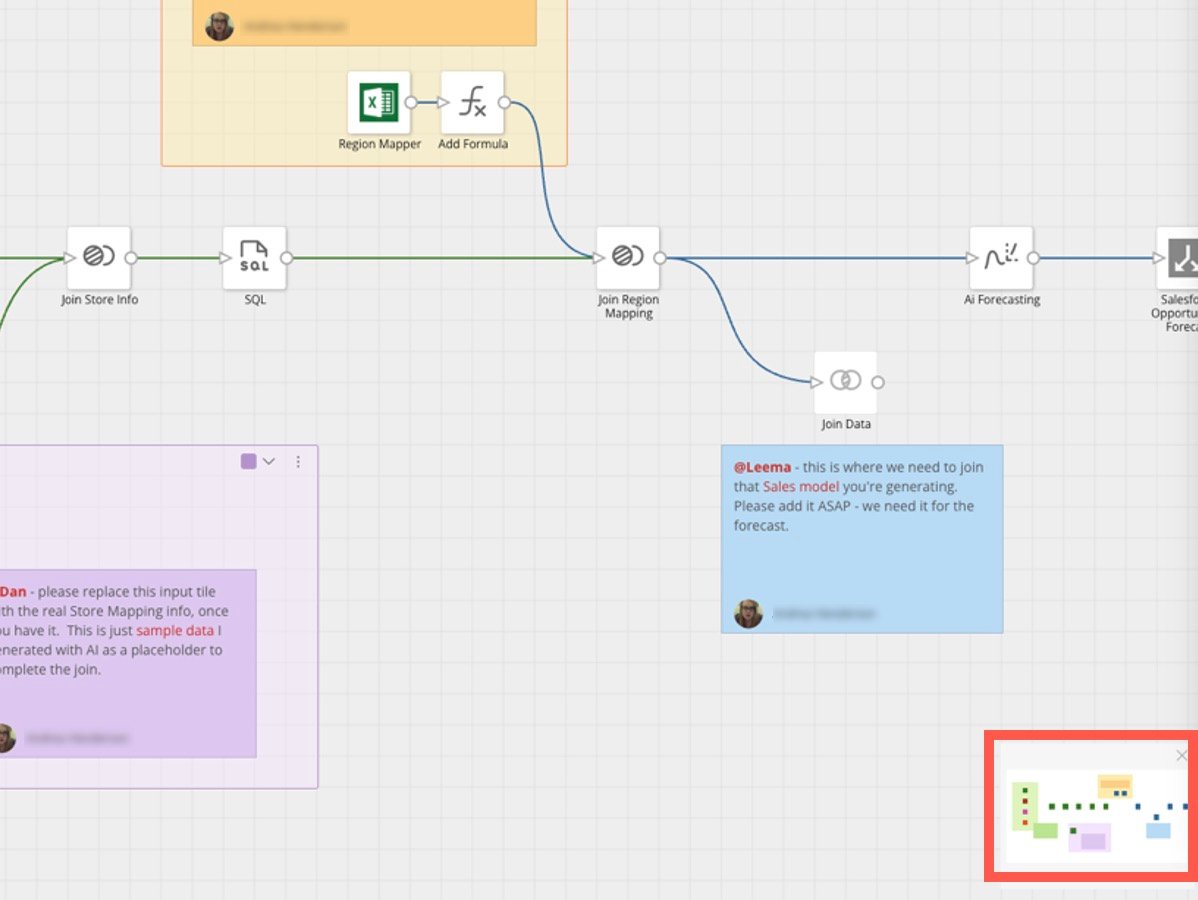 If you close the mini map, reopen it by selecting the map pointer icon in the same corner where it appears.
 ##### Tile Grouping
You can also select a number of tiles at once by clicking on the canvas and then dragging the cursor over them. When multiple tiles are selected, you can drag all of the selected tiles as a group to where you want them. You can also delete the selected tiles by selecting **Delete** in the left panel.
##### Tile Support
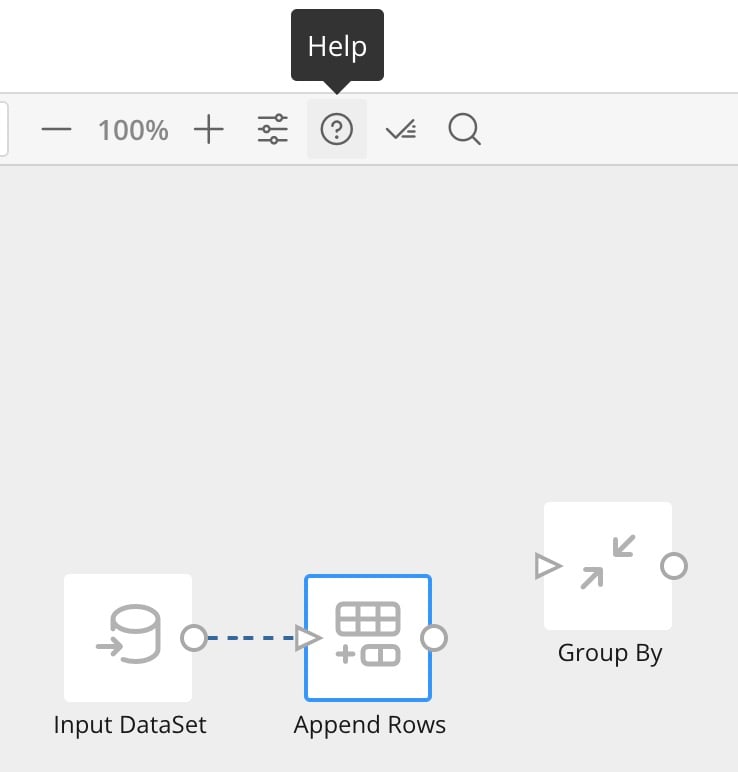
You can get help while configuring a tile on the canvas by selecting the tile and then selecting **Help** (question mark icon).
##### Tile Grouping
You can also select a number of tiles at once by clicking on the canvas and then dragging the cursor over them. When multiple tiles are selected, you can drag all of the selected tiles as a group to where you want them. You can also delete the selected tiles by selecting **Delete** in the left panel.
##### Tile Support
You can get help while configuring a tile on the canvas by selecting the tile and then selecting **Help** (question mark icon).
 ##### Undo/Redo
You can undo/redo actions taken while creating a Magic ETL DataFlow. The controls (arrow icons) are found in the toolbar at the top of the canvas.
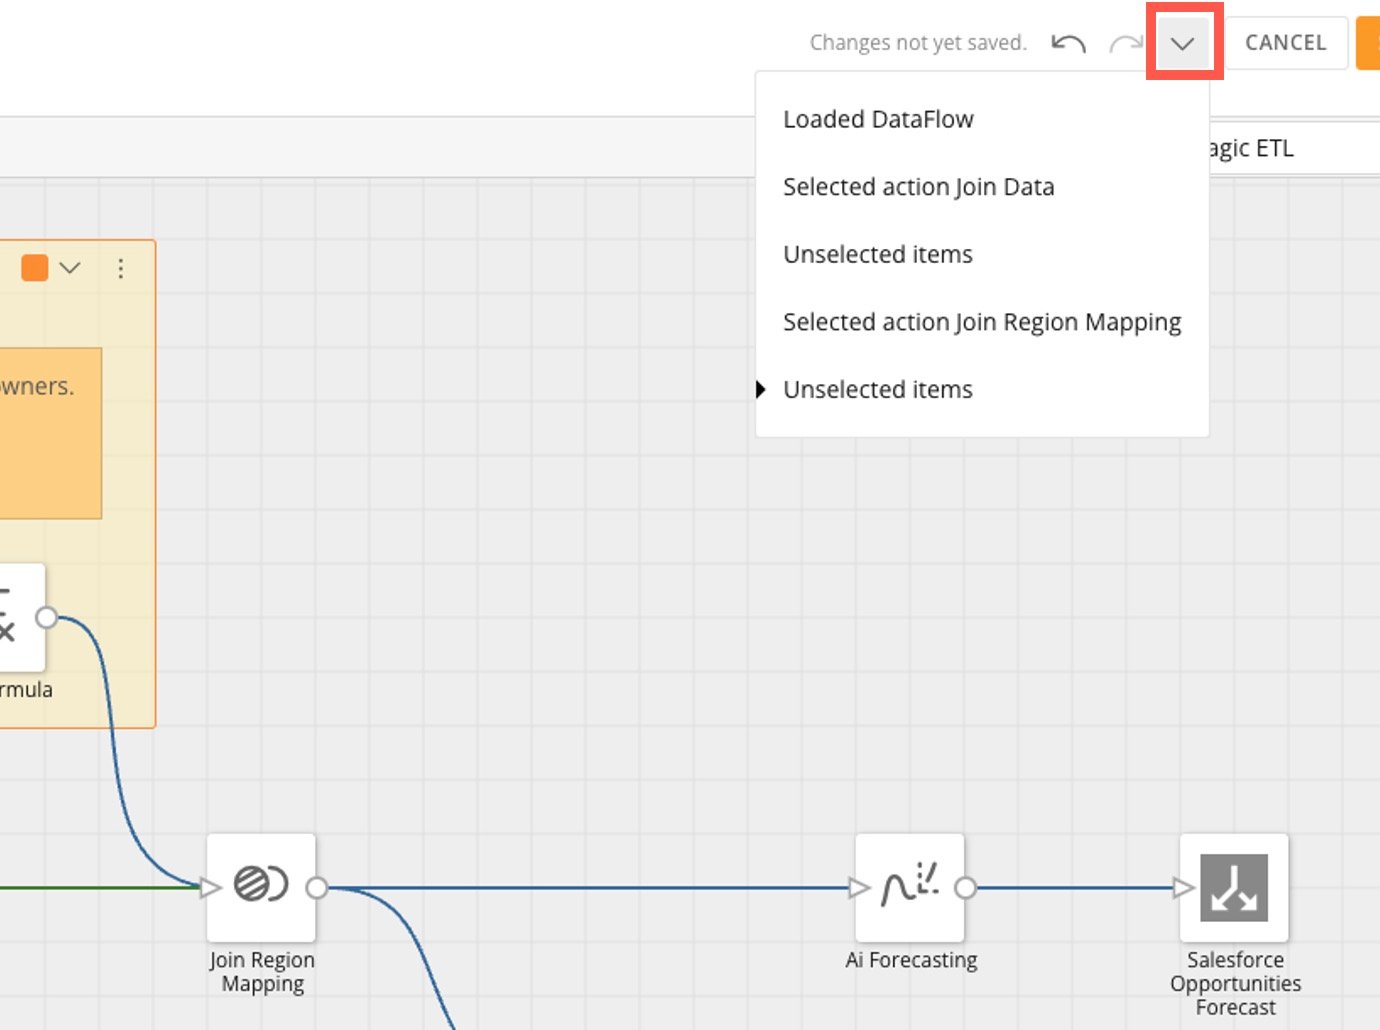
You can also use the dropdown to view an action history list of all actions taken during a given editing session. Using the list, you can jump forward and backward in time to see the DataFlow in that state.
##### Undo/Redo
You can undo/redo actions taken while creating a Magic ETL DataFlow. The controls (arrow icons) are found in the toolbar at the top of the canvas.
You can also use the dropdown to view an action history list of all actions taken during a given editing session. Using the list, you can jump forward and backward in time to see the DataFlow in that state.
 **Warning:**
The action history is not available for past editing sessions or across users.
# Use Sections
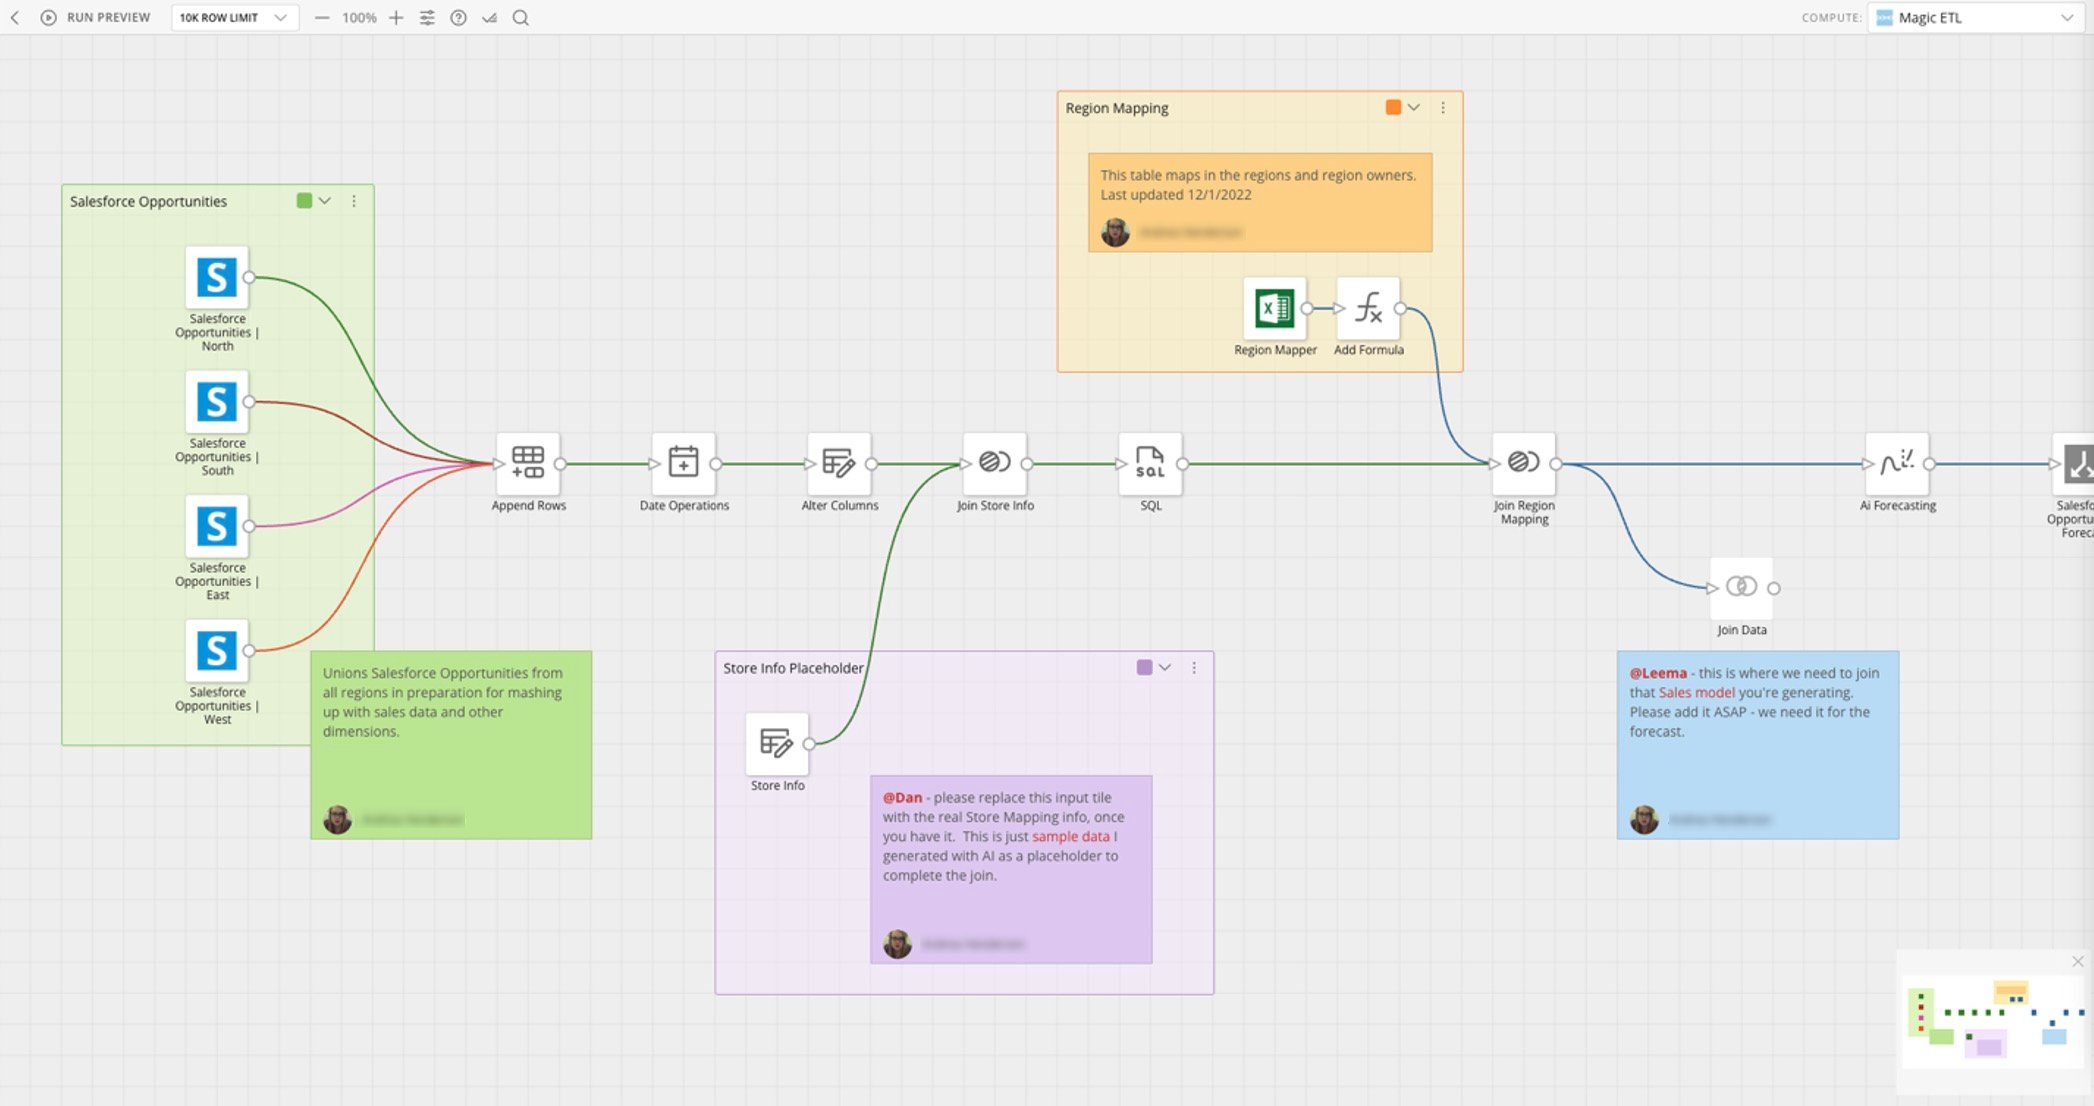
Sections can help you organize your canvas by logically and visually grouping tiles together.
Add one or more sections to your canvas by following the steps below:
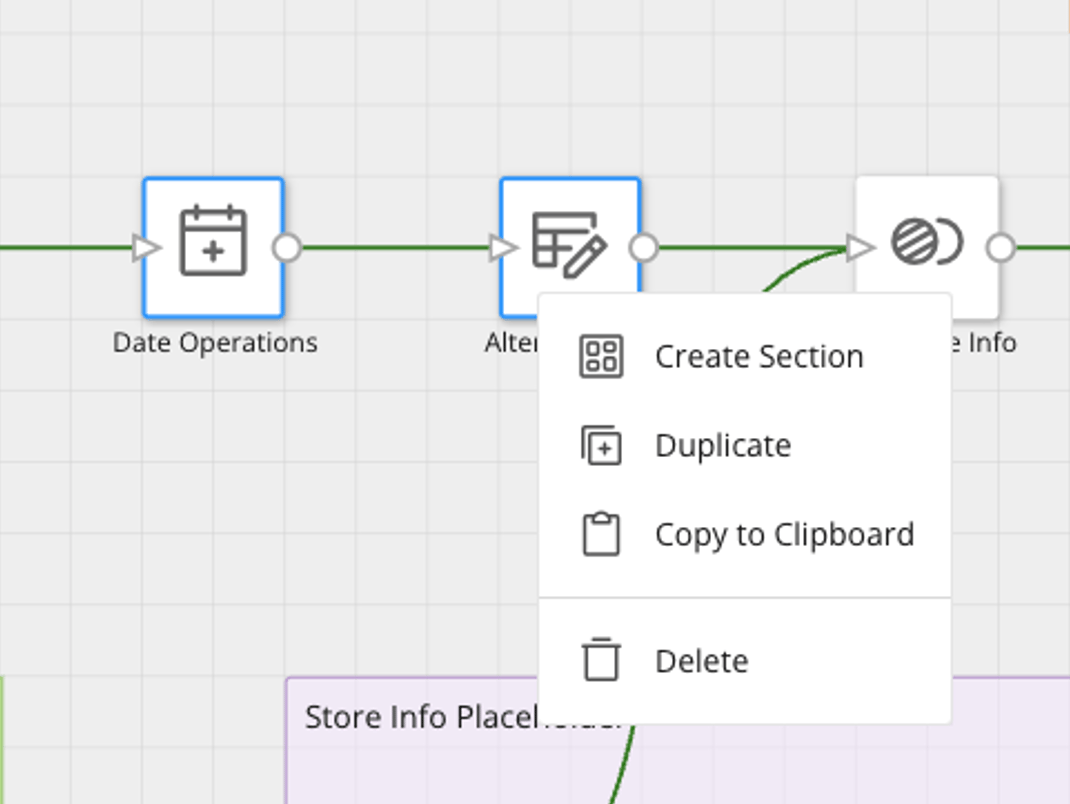
1. Highlight the tile(s) you want to include in a section and right-click to display the section options.
2. Select
**Create Section**.
**Warning:**
The action history is not available for past editing sessions or across users.
# Use Sections
Sections can help you organize your canvas by logically and visually grouping tiles together.
Add one or more sections to your canvas by following the steps below:
1. Highlight the tile(s) you want to include in a section and right-click to display the section options.
2. Select
**Create Section**.
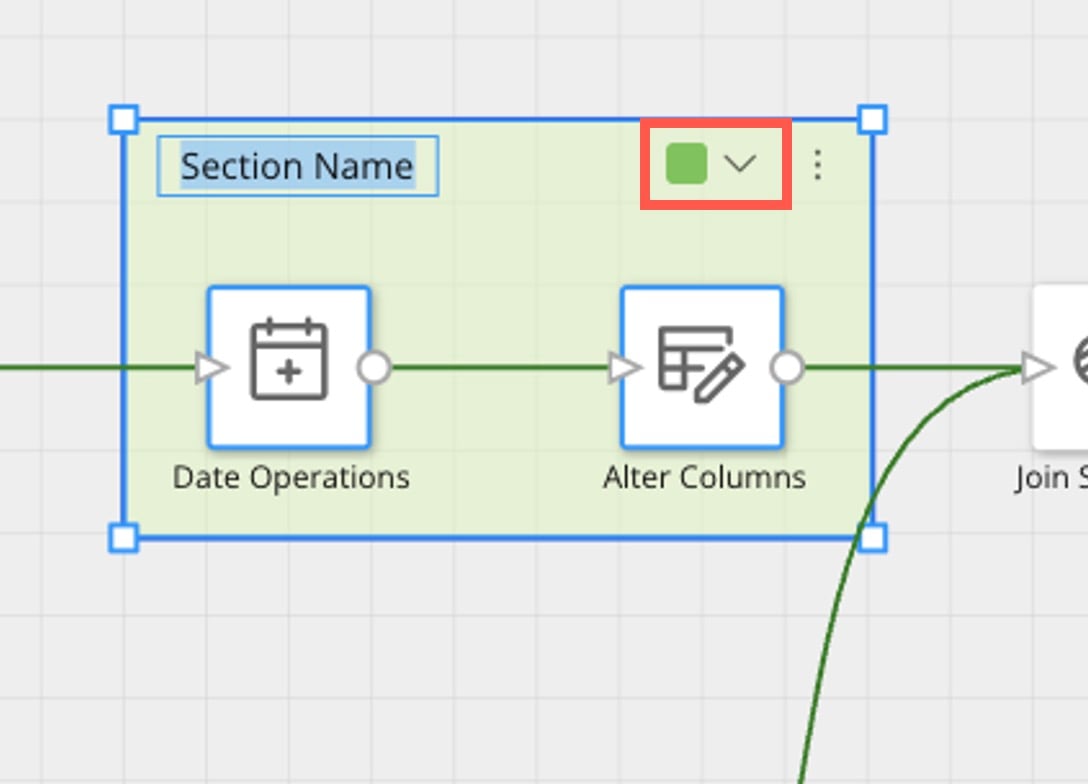
 3. After creating a section, you can use the color picker to choose a background color.
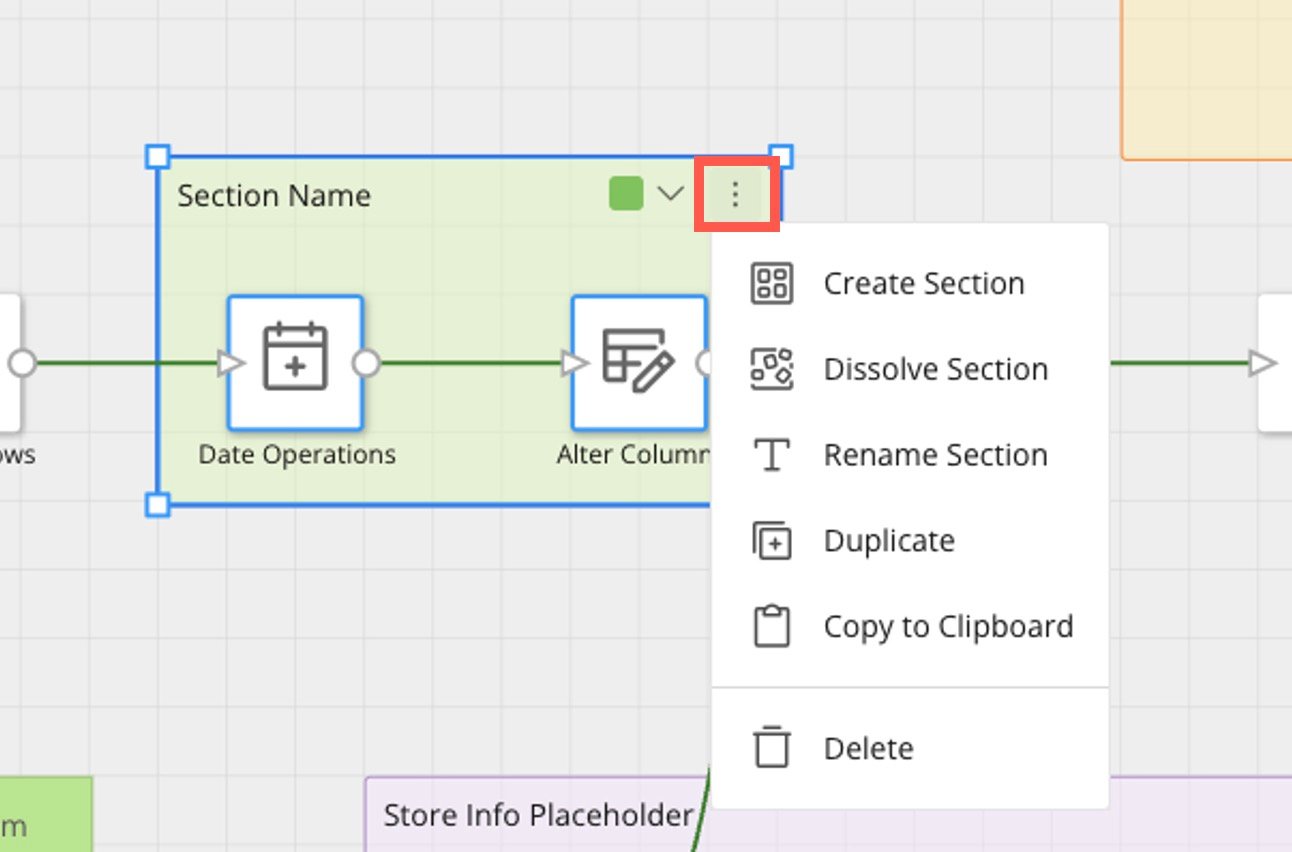
 4. (Optional) Rename a section by selecting
**More** (three vertical dots icon) > **Rename Section**.
4. (Optional) Rename a section by selecting
**More** (three vertical dots icon) > **Rename Section**.
 5. (Optional) Resize a section by clicking and dragging its edges or corners.
**Note:** A section will pick up tiles and notes that are overlapped when resizing.
6. (Optional) Group a
[sticky note](#use_sticky_notes) with a section by dropping it into the section or dragging the edge of the section over the sticky note.
# Use Sticky Notes
Sticky notes help you document and annotate so you can communicate to a DataFlow viewer about the DataFlow's current status, history, and work that may need to be done.
1. Right-click anywhere on the Magic ETL canvas and choose
**Add Comment**.
5. (Optional) Resize a section by clicking and dragging its edges or corners.
**Note:** A section will pick up tiles and notes that are overlapped when resizing.
6. (Optional) Group a
[sticky note](#use_sticky_notes) with a section by dropping it into the section or dragging the edge of the section over the sticky note.
# Use Sticky Notes
Sticky notes help you document and annotate so you can communicate to a DataFlow viewer about the DataFlow's current status, history, and work that may need to be done.
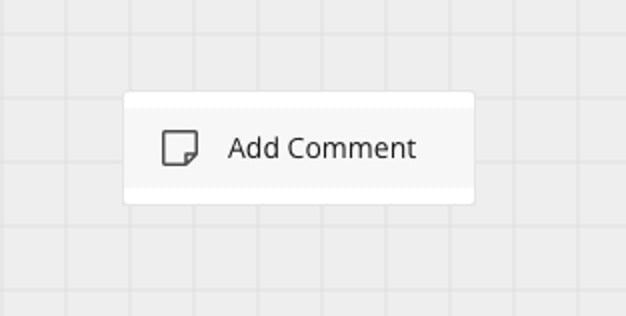
1. Right-click anywhere on the Magic ETL canvas and choose
**Add Comment**.
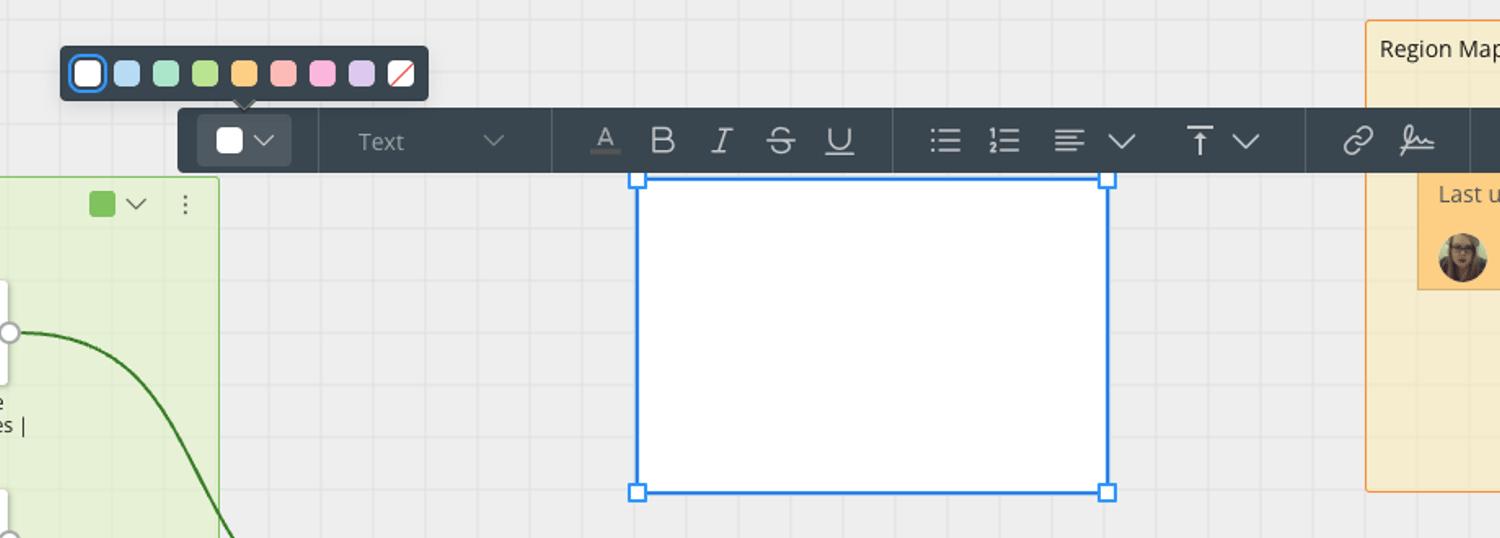
 A sticky note appears with an editing bar along the top.
2. Use the editing bar to choose a note color and other rich text options, including hyperlinking.
A sticky note appears with an editing bar along the top.
2. Use the editing bar to choose a note color and other rich text options, including hyperlinking.
 **Tip:**
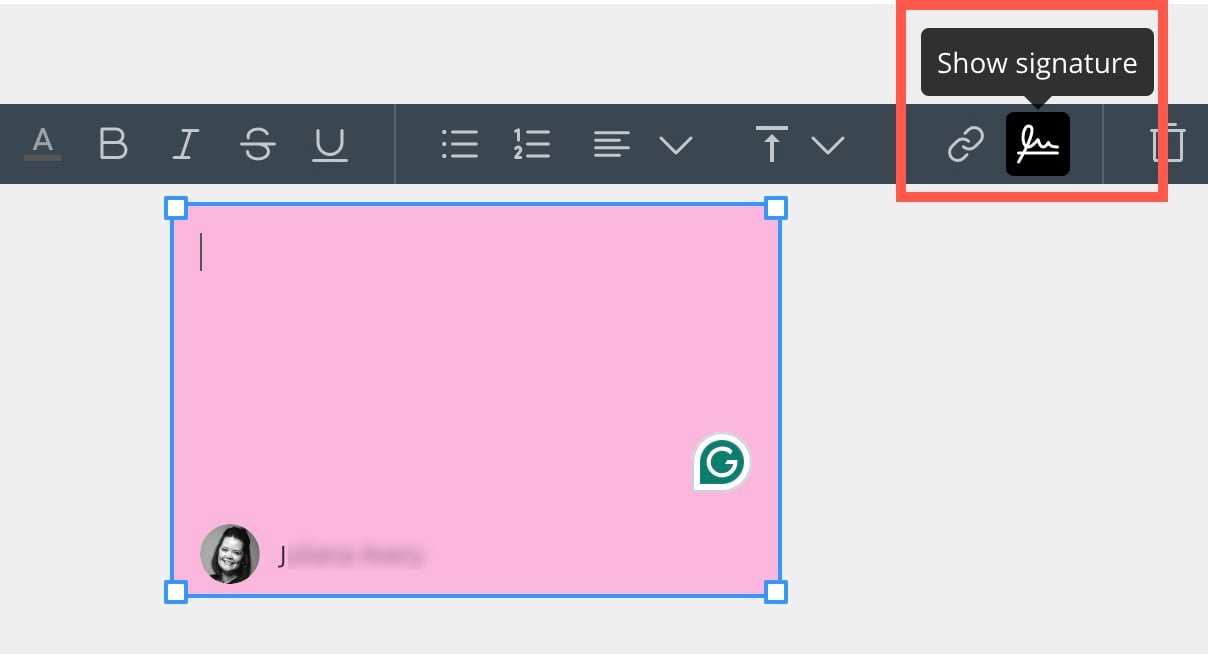
You can stamp your signature on a sticky note so people can identify the author.
**Tip:**
You can stamp your signature on a sticky note so people can identify the author.
 3. (Optional) You can group a sticky note with a section by dragging it at least halfway onto the section.
 # Use Column Search
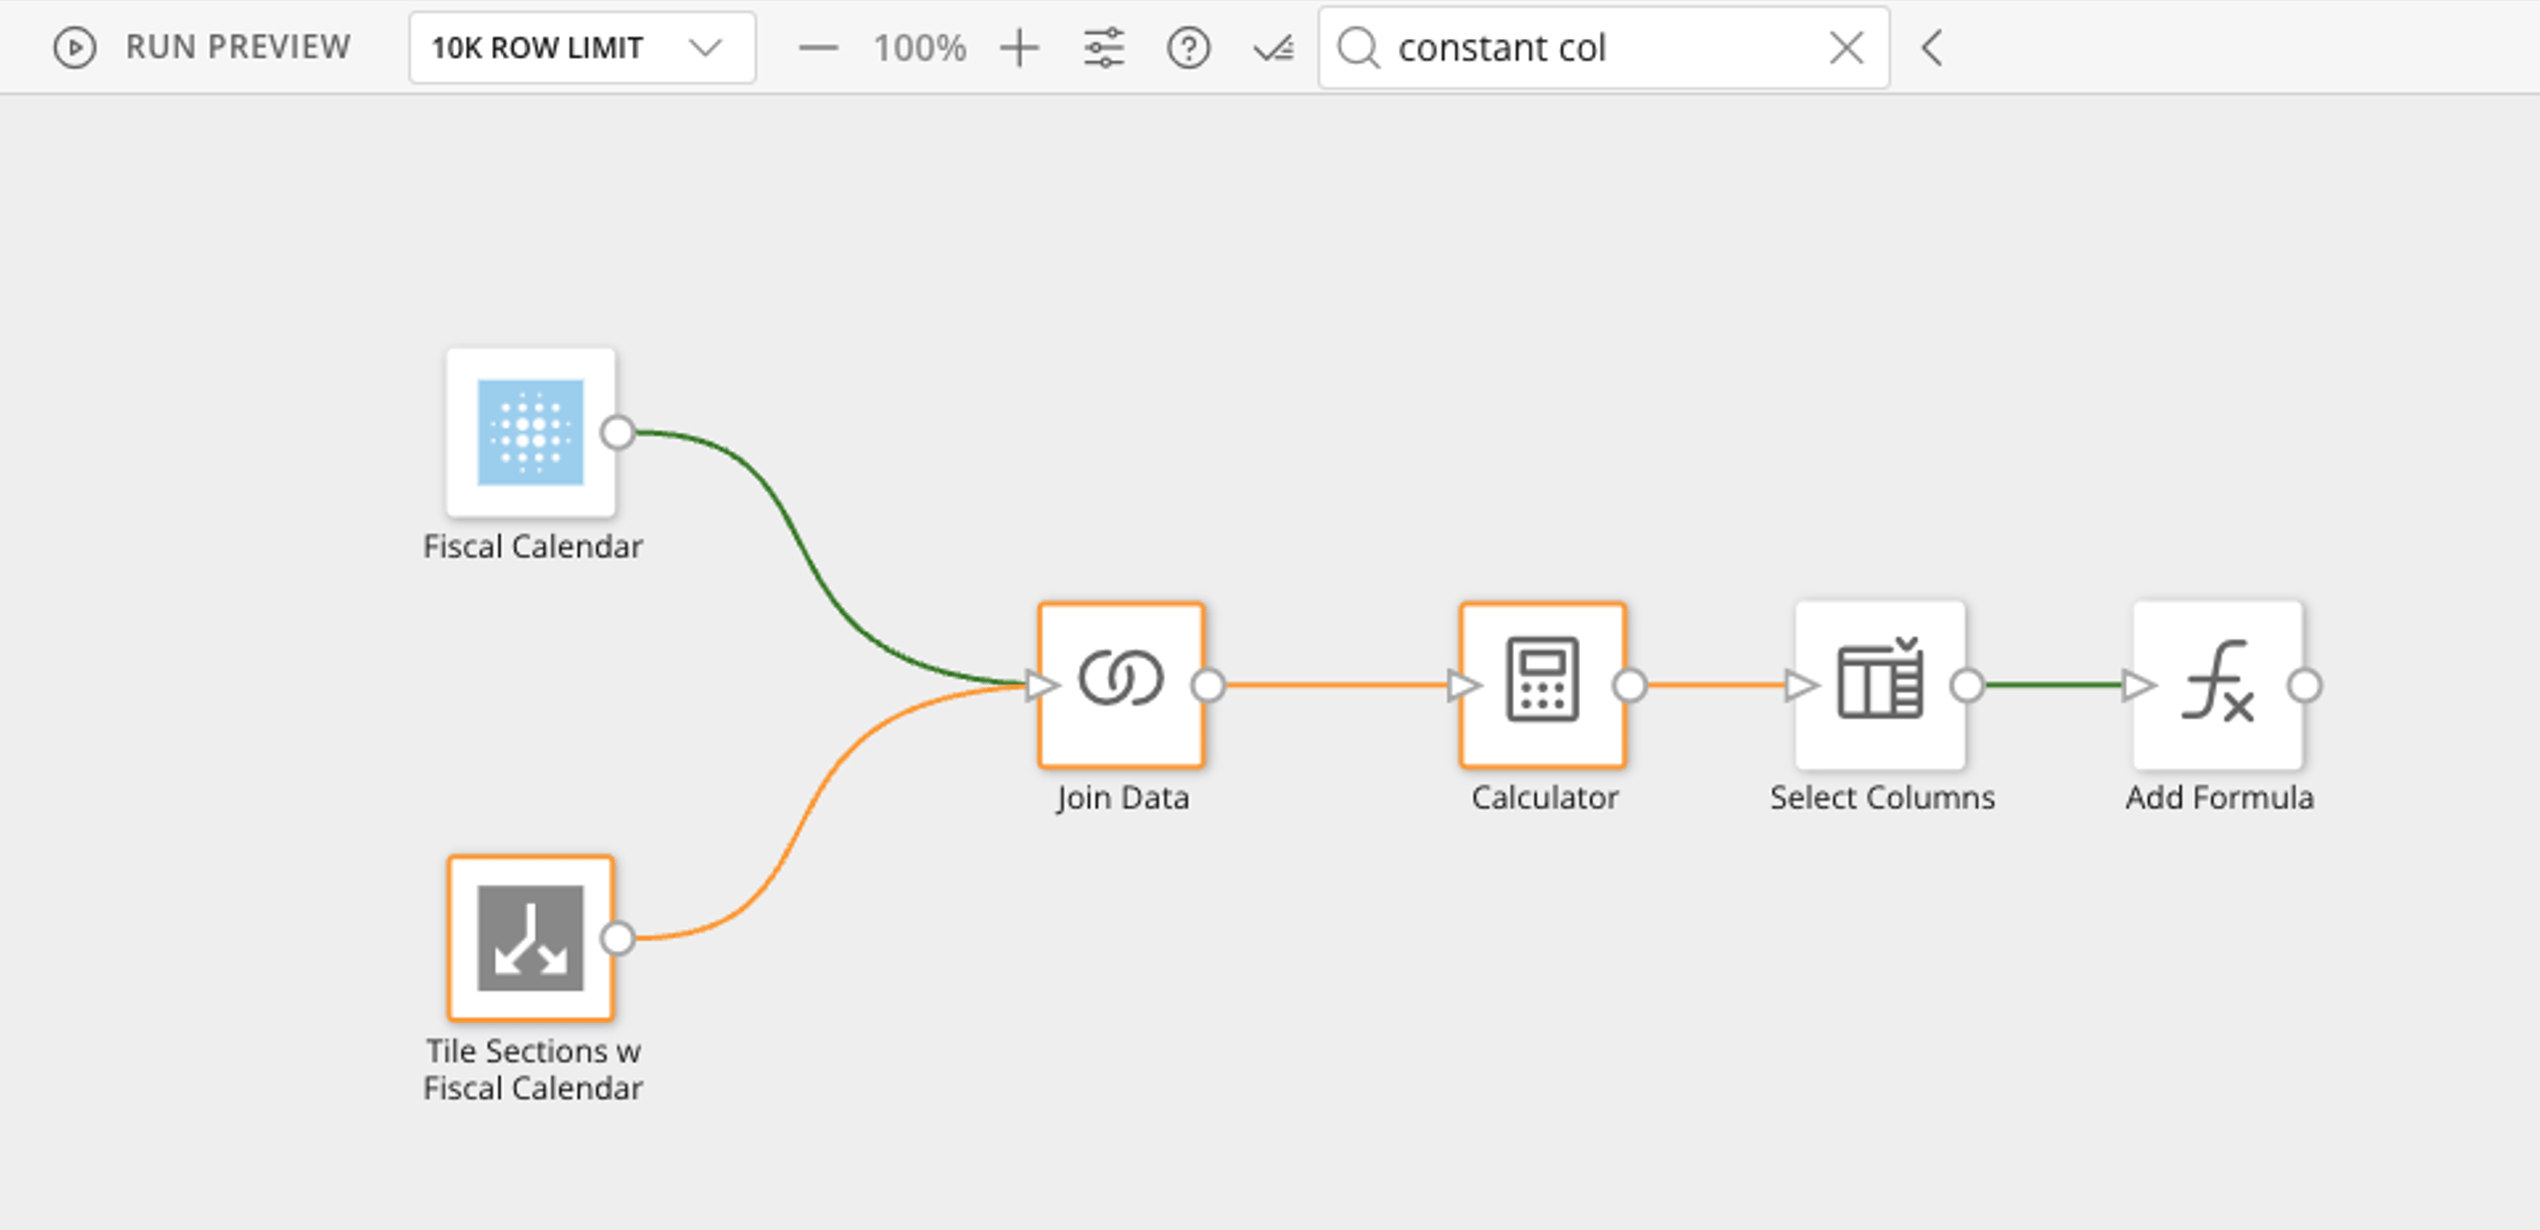
Column Search in Magic ETL allows you to view all tiles in your DataFlow that contain a certain column. Follow these steps to use Column Search:
1. While creating your DataFlow, select the magnifying glass in the utility bar above the canvas to expand the search field.
# Use Column Search
Column Search in Magic ETL allows you to view all tiles in your DataFlow that contain a certain column. Follow these steps to use Column Search:
1. While creating your DataFlow, select the magnifying glass in the utility bar above the canvas to expand the search field.
 2. Enter a partial or complete column name in the search field. All entered characters are included in the search.
 3. Observe the orange-highlighted tiles (and relevant paths) on the canvas. Each highlighted tile includes a column that matches your search term(s).
**Tip:**
If you have any tiles selected when you search, you won't observe the orange highlighting around that tile until you deselect them, though connecting paths are still highlighted.
3. Observe the orange-highlighted tiles (and relevant paths) on the canvas. Each highlighted tile includes a column that matches your search term(s).
**Tip:**
If you have any tiles selected when you search, you won't observe the orange highlighting around that tile until you deselect them, though connecting paths are still highlighted.
 **Does this feature also search the formula fields for the column name text?**
No, it only searches the data schema available to that tile. (Searching formula fields is a potential future enhancement.)
### Create a Magic ETL DataFlow
Follow these steps to create a Magic ETL DataFlow:
1. Navigate to the Domo Data Center (**More** > **Data**).
2. If you aren't already there, use the left sidebar to go to the
**Data Warehouse**.
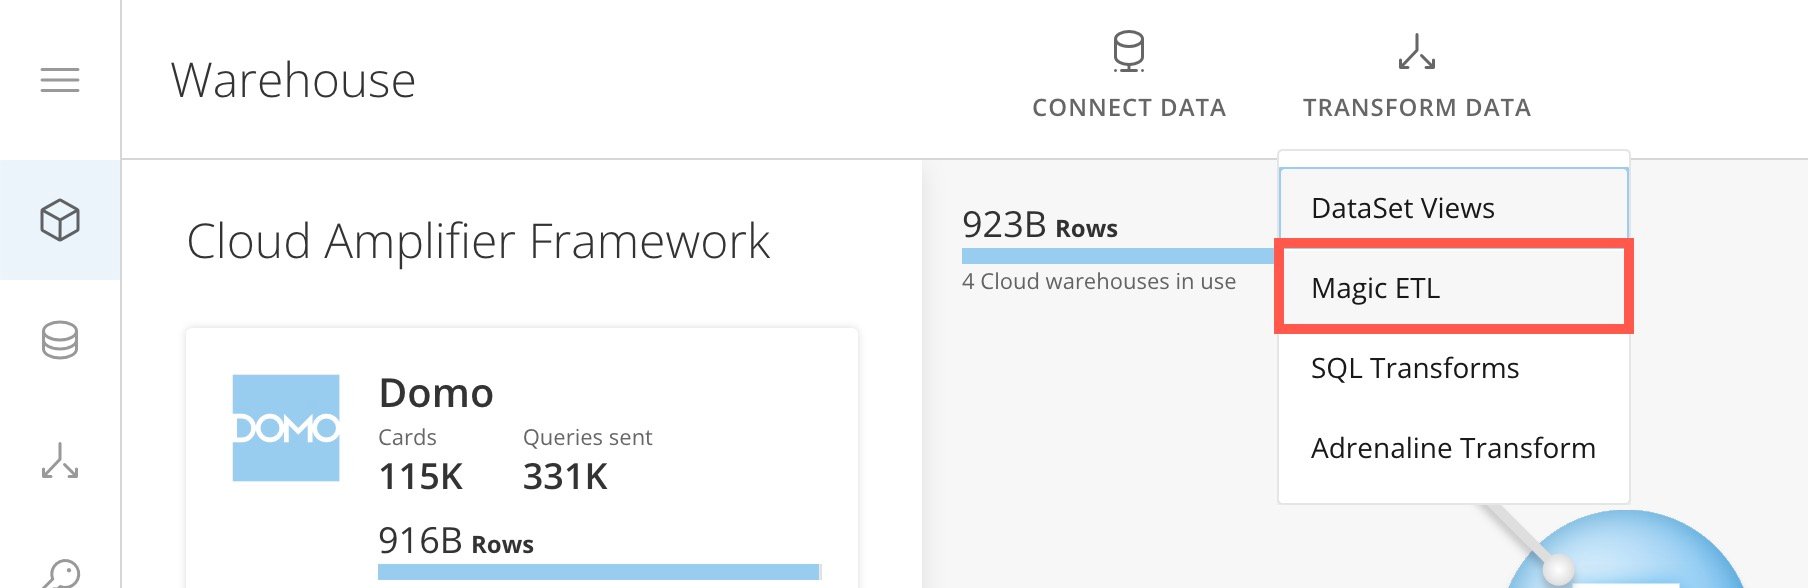
3. In the ribbon at the top of the Data Center, select
**Transform** **Data** > **Magic ETL** to open the Magic ETL canvas.
**Does this feature also search the formula fields for the column name text?**
No, it only searches the data schema available to that tile. (Searching formula fields is a potential future enhancement.)
### Create a Magic ETL DataFlow
Follow these steps to create a Magic ETL DataFlow:
1. Navigate to the Domo Data Center (**More** > **Data**).
2. If you aren't already there, use the left sidebar to go to the
**Data Warehouse**.
3. In the ribbon at the top of the Data Center, select
**Transform** **Data** > **Magic ETL** to open the Magic ETL canvas.
 4. In the left panel, expand
**DataSets** and drag an **Input DataSet** tile to the canvas.
4. In the left panel, expand
**DataSets** and drag an **Input DataSet** tile to the canvas.
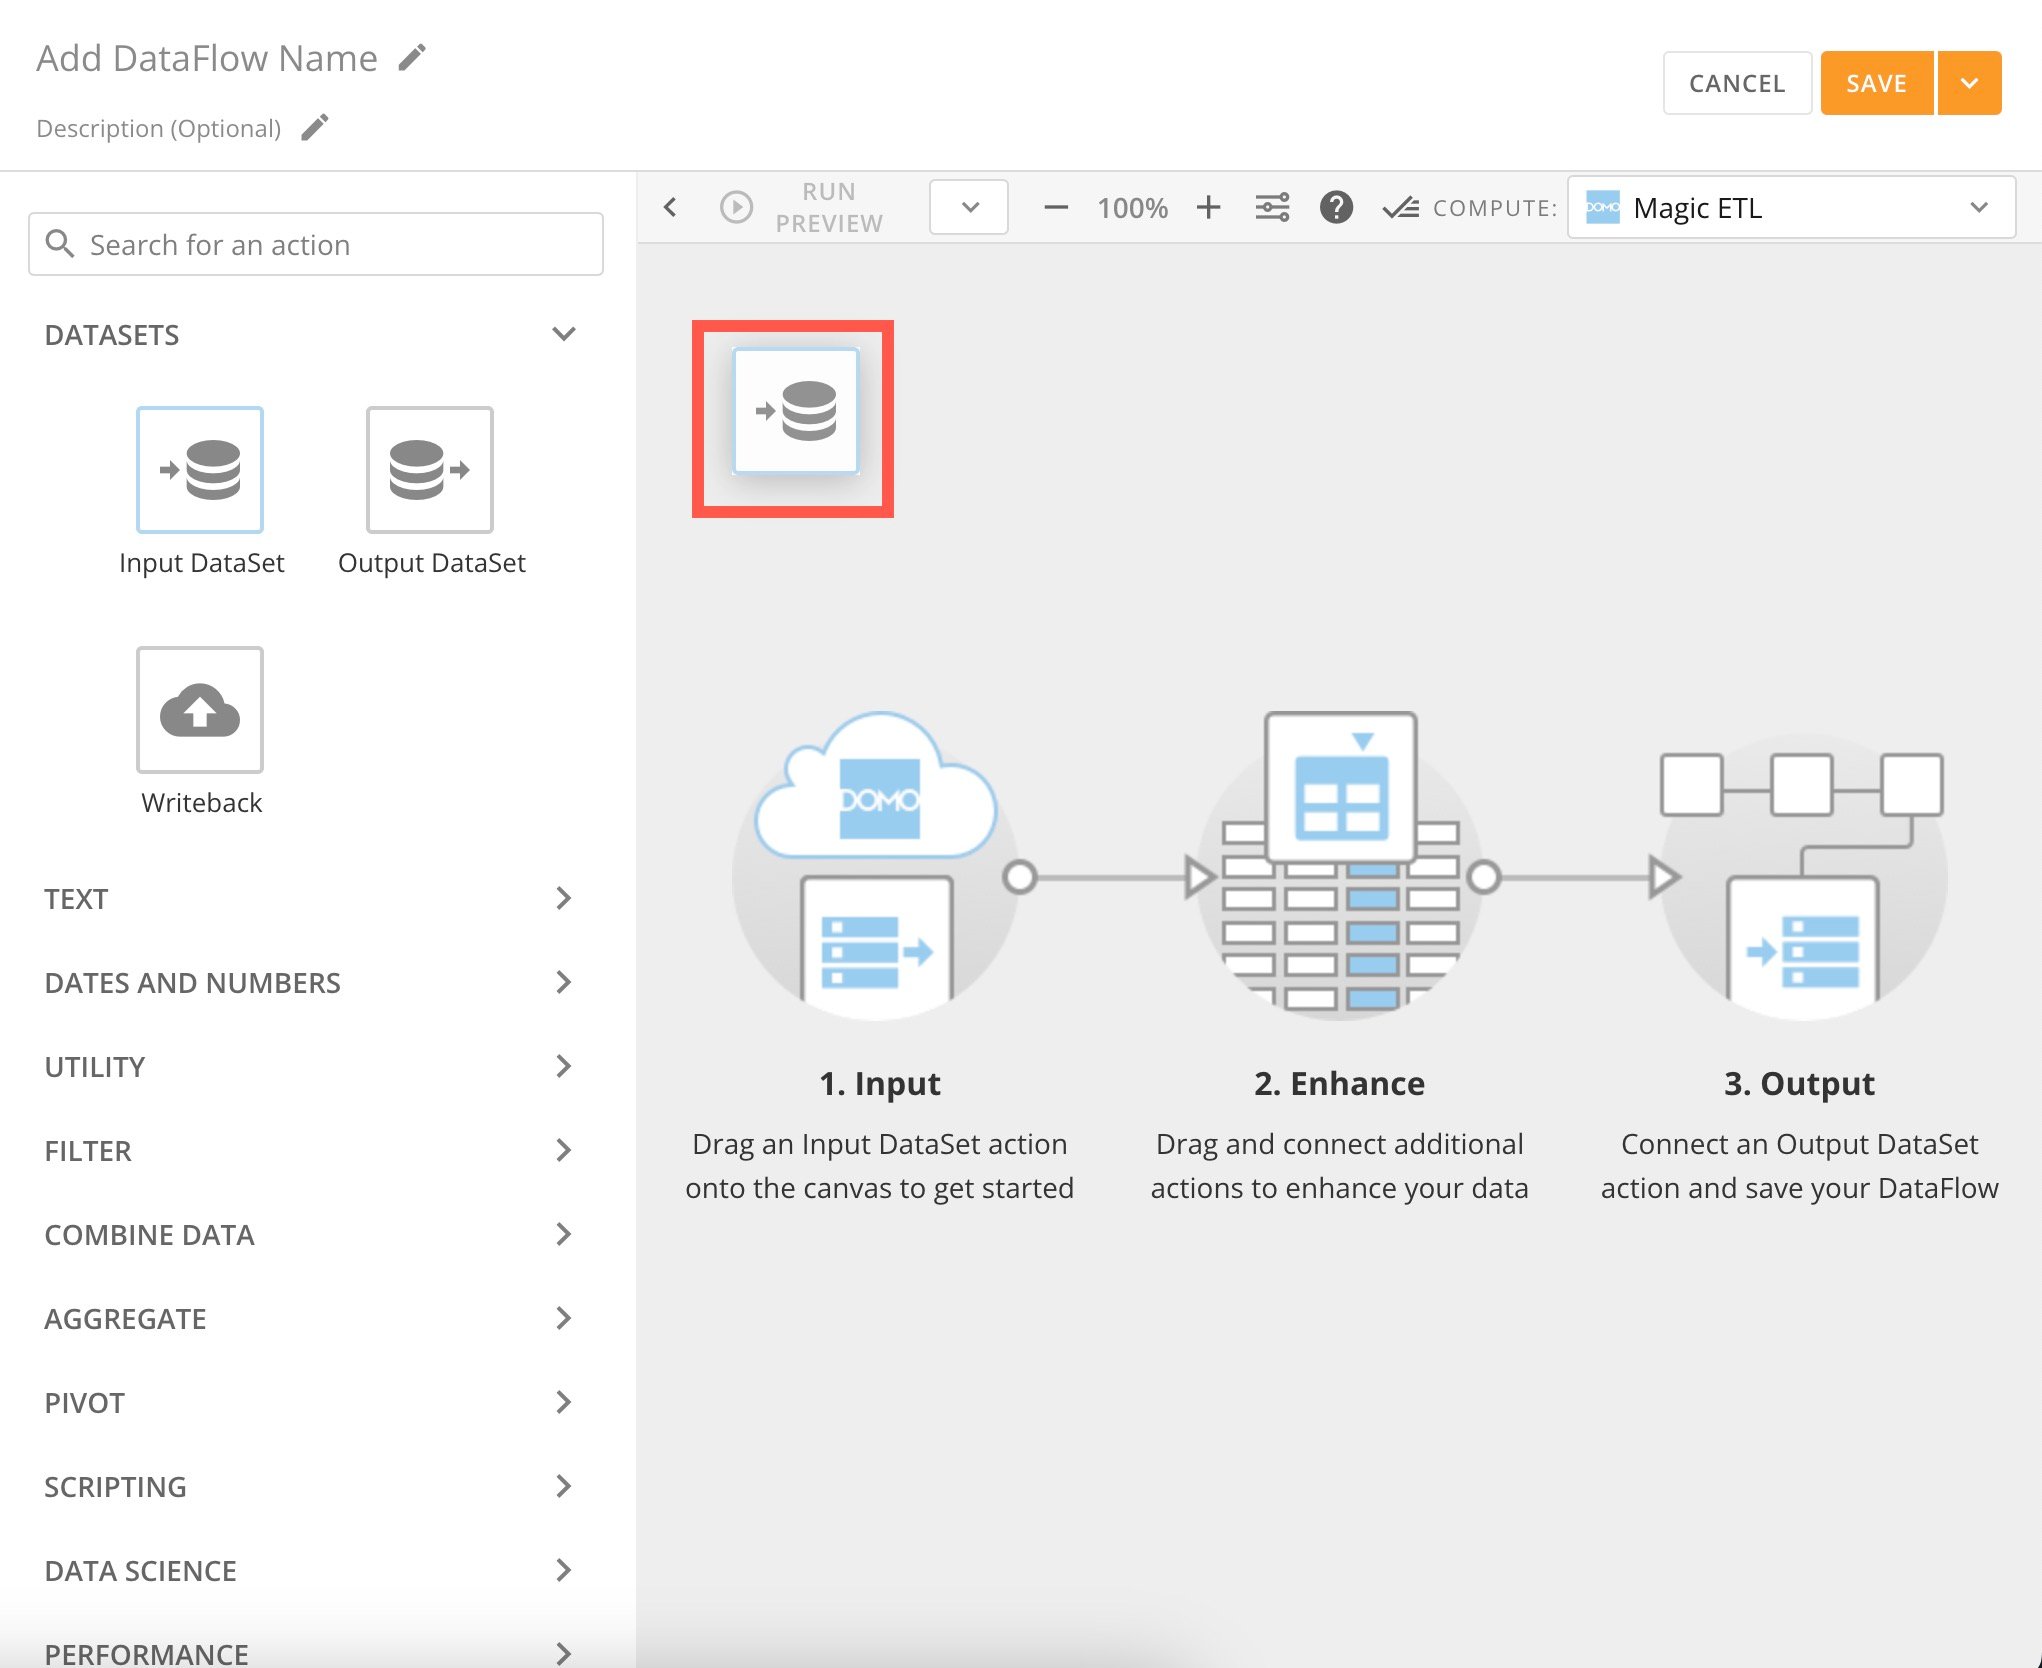 The tile editor expands below the canvas.
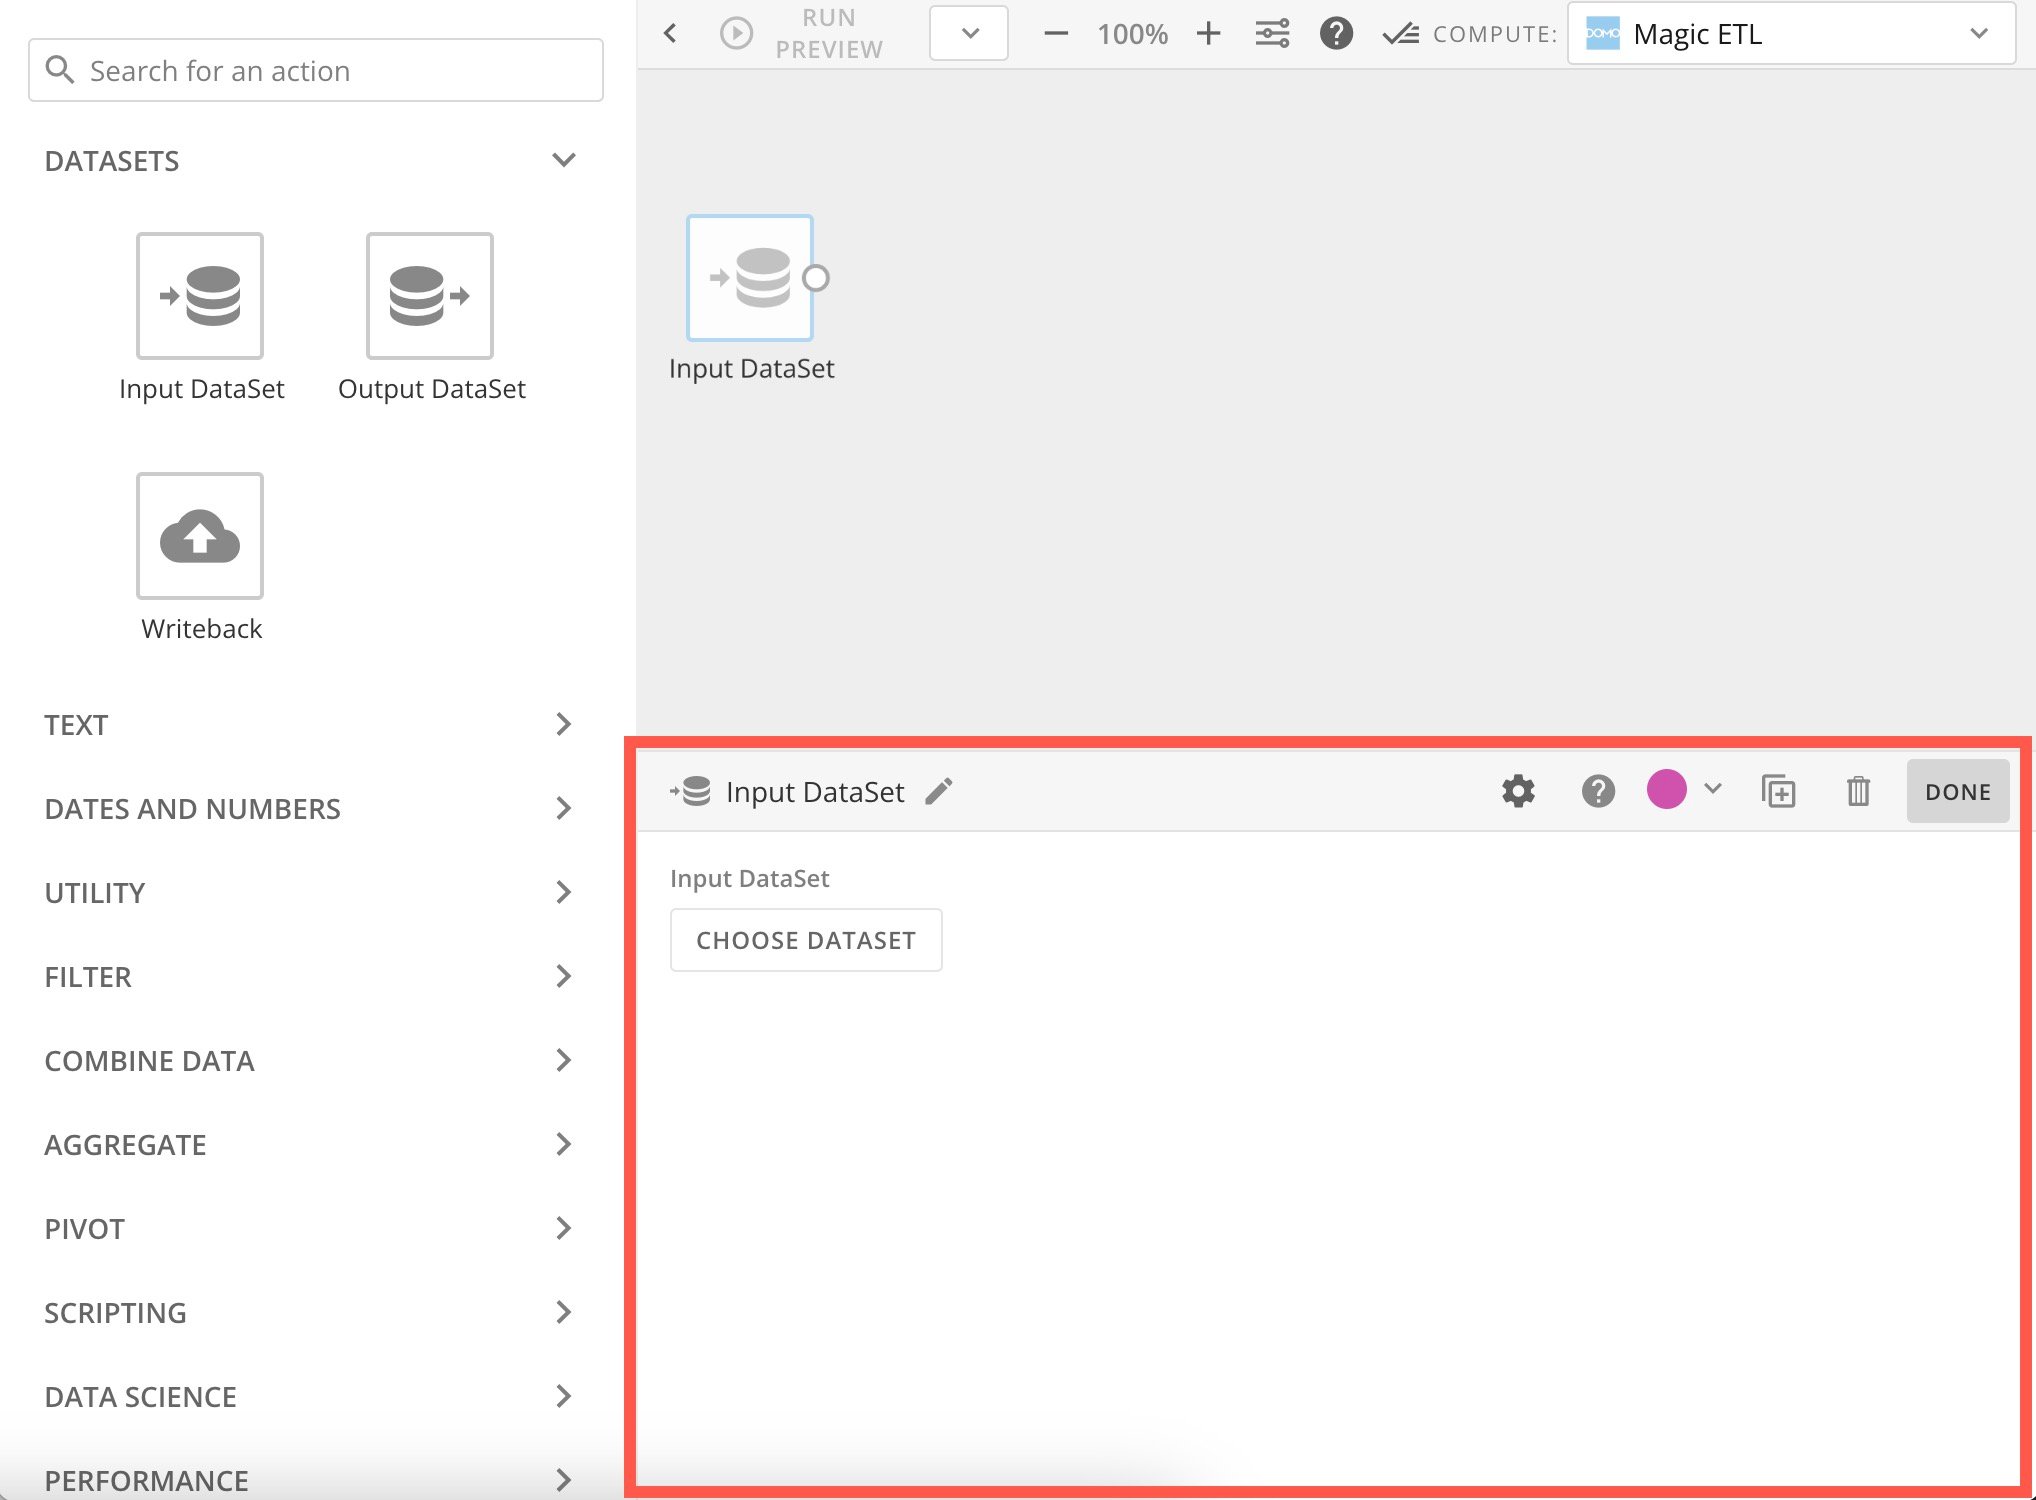 5. In the tile editor, select
**Choose DataSet** to choose the DataSet you want to transform.
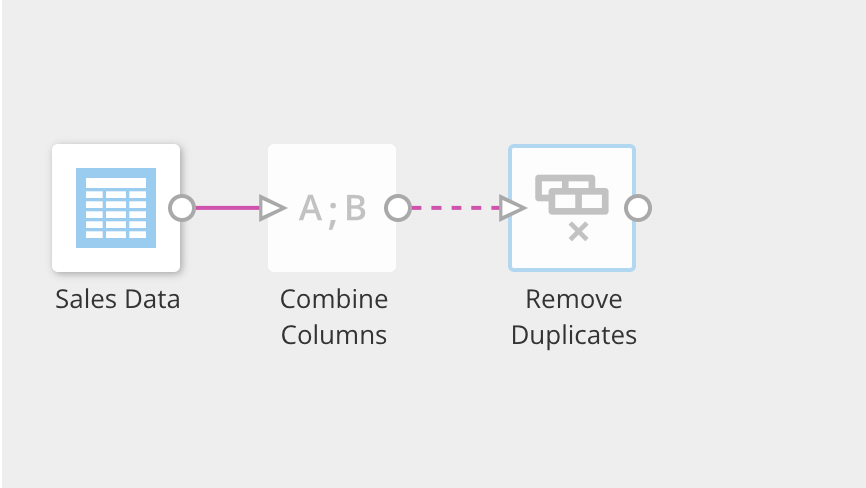
6. Drag other tiles to the canvas, depending on what transformations you want to make, and make sure they are all connected by dragging the nodes on the sides of each tile to the node on the next tile.
**Note:**
You must configure each tile in the editor before you can configure the following tile. If a tile is not configured, the connector to the next tile appears as a dashed line.
5. In the tile editor, select
**Choose DataSet** to choose the DataSet you want to transform.
6. Drag other tiles to the canvas, depending on what transformations you want to make, and make sure they are all connected by dragging the nodes on the sides of each tile to the node on the next tile.
**Note:**
You must configure each tile in the editor before you can configure the following tile. If a tile is not configured, the connector to the next tile appears as a dashed line.
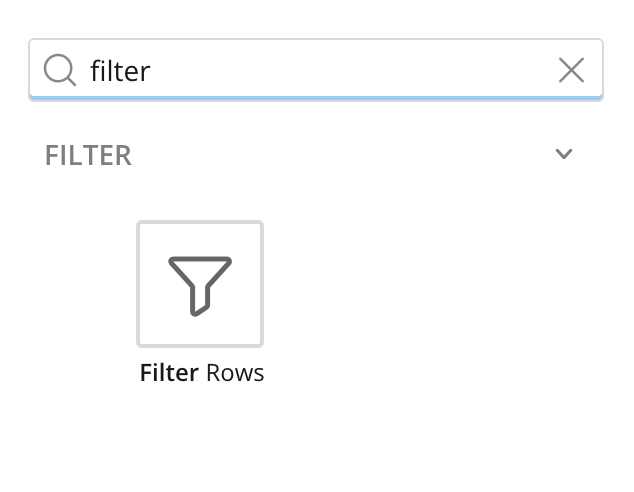
 **Tip:**
Use the search tool in the left panel to find the tile you need.
**Tip:**
Use the search tool in the left panel to find the tile you need.
 7. After configuring all your other tiles, add an output DataSet by dragging an
**Output DataSet** tile from the **DataSets** tiles to the canvas and connecting it to the last configured tile.
8. Configure the
**Output DataSet** tile by doing the following:
1. Connect a tile to the
**Output DataSet** tile.
2. Select the
**Output DataSet** tile, then enter a name for the new output DataSet.
9. (Optional) Schedule the DataFlow. By default, you must run the DataFlow manually. You can schedule it to run when a trigger activates. See
[Advanced DataFlow Triggering](/s/article/000005216) to learn more.
10. Enter a name and description for the DataFlow.
11. Select
**Save** to keep your changes, adding an optional version description before saving again.
When you save a DataFlow, an entry for this version is added to the **Versions** tab in the Details view for the DataFlow. If you add a version description, it appears in the version entry. Learn about [Viewing the Version History for a DataFlow](/s/article/360042923074 "Viewing the Version History for a DataFlow").
* (Conditional) If you choose
**Save and Run**, you can add a description of the DataFlow version and any triggers, then select **Save and Run** again.
The **History** tab of the DataFlow Details opens, displaying run statistics and other information.
7. After configuring all your other tiles, add an output DataSet by dragging an
**Output DataSet** tile from the **DataSets** tiles to the canvas and connecting it to the last configured tile.
8. Configure the
**Output DataSet** tile by doing the following:
1. Connect a tile to the
**Output DataSet** tile.
2. Select the
**Output DataSet** tile, then enter a name for the new output DataSet.
9. (Optional) Schedule the DataFlow. By default, you must run the DataFlow manually. You can schedule it to run when a trigger activates. See
[Advanced DataFlow Triggering](/s/article/000005216) to learn more.
10. Enter a name and description for the DataFlow.
11. Select
**Save** to keep your changes, adding an optional version description before saving again.
When you save a DataFlow, an entry for this version is added to the **Versions** tab in the Details view for the DataFlow. If you add a version description, it appears in the version entry. Learn about [Viewing the Version History for a DataFlow](/s/article/360042923074 "Viewing the Version History for a DataFlow").
* (Conditional) If you choose
**Save and Run**, you can add a description of the DataFlow version and any triggers, then select **Save and Run** again.
The **History** tab of the DataFlow Details opens, displaying run statistics and other information.
 **Why are output DataSets not marked as**
Updated
**when the DataFlow completes successfully?**
This is usually because the data has not actually changed—no update has occurred. A DataSet displays as updated if the data has changed during a successful DataFlow execution.
### Best Practices for Magic ETL DataFlows
We recommend the following for your DataFlow:
* Only include the DataSets that are necessary to create the output DataSet.
* Filter out rows that you don't need at the
*beginning* of the DataFlow. Learn about [Filter tiles](/s/article/360044876614).
* Reduce the number of columns to only those you need.
* Use descriptive names for each tile in your DataFlow.
* List the following in your DataFlow description:
* The input DataSets being transformed and their owner's names.
* The output DataSet created.
* Give your DataFlow the same name as the output DataSet. This is because the outputs of a DataFlow become their own DataSet in the Data Center, and this allows you to more easily identify which DataFlows contribute to which output DataSets.
* Be aware that some tiles take longer to execute than others, including:
* [Group By](https://domo-support.domo.com/s/article/360044876094?language=en_US#group_by_tile)
* [Rank & Window](https://domo-support.domo.com/s/article/360044876094?language=en_US#rank_and_window_tile)
* [Join Data](https://domo-support.domo.com/s/article/360044876194?language=en_US#join_data_tile)
* [Remove Duplicates](https://domo-support.domo.com/s/article/360044876614?language=en_US#remove_duplicates)
* [Pivot](https://domo-support.domo.com/s/article/360044951294?language=en_US#pivot_tile)
* [Scripting tiles](/s/article/360045485833)
* [Data Science tiles](/s/article/360045259294)
### Recover Unsaved Changes
If you close the window without saving your DataFlow, you can recover it by following these steps:
1. Access the DataFlow that was closed without saving.
Notice the blue banner at the top of the DataFlow.
**Why are output DataSets not marked as**
Updated
**when the DataFlow completes successfully?**
This is usually because the data has not actually changed—no update has occurred. A DataSet displays as updated if the data has changed during a successful DataFlow execution.
### Best Practices for Magic ETL DataFlows
We recommend the following for your DataFlow:
* Only include the DataSets that are necessary to create the output DataSet.
* Filter out rows that you don't need at the
*beginning* of the DataFlow. Learn about [Filter tiles](/s/article/360044876614).
* Reduce the number of columns to only those you need.
* Use descriptive names for each tile in your DataFlow.
* List the following in your DataFlow description:
* The input DataSets being transformed and their owner's names.
* The output DataSet created.
* Give your DataFlow the same name as the output DataSet. This is because the outputs of a DataFlow become their own DataSet in the Data Center, and this allows you to more easily identify which DataFlows contribute to which output DataSets.
* Be aware that some tiles take longer to execute than others, including:
* [Group By](https://domo-support.domo.com/s/article/360044876094?language=en_US#group_by_tile)
* [Rank & Window](https://domo-support.domo.com/s/article/360044876094?language=en_US#rank_and_window_tile)
* [Join Data](https://domo-support.domo.com/s/article/360044876194?language=en_US#join_data_tile)
* [Remove Duplicates](https://domo-support.domo.com/s/article/360044876614?language=en_US#remove_duplicates)
* [Pivot](https://domo-support.domo.com/s/article/360044951294?language=en_US#pivot_tile)
* [Scripting tiles](/s/article/360045485833)
* [Data Science tiles](/s/article/360045259294)
### Recover Unsaved Changes
If you close the window without saving your DataFlow, you can recover it by following these steps:
1. Access the DataFlow that was closed without saving.
Notice the blue banner at the top of the DataFlow.
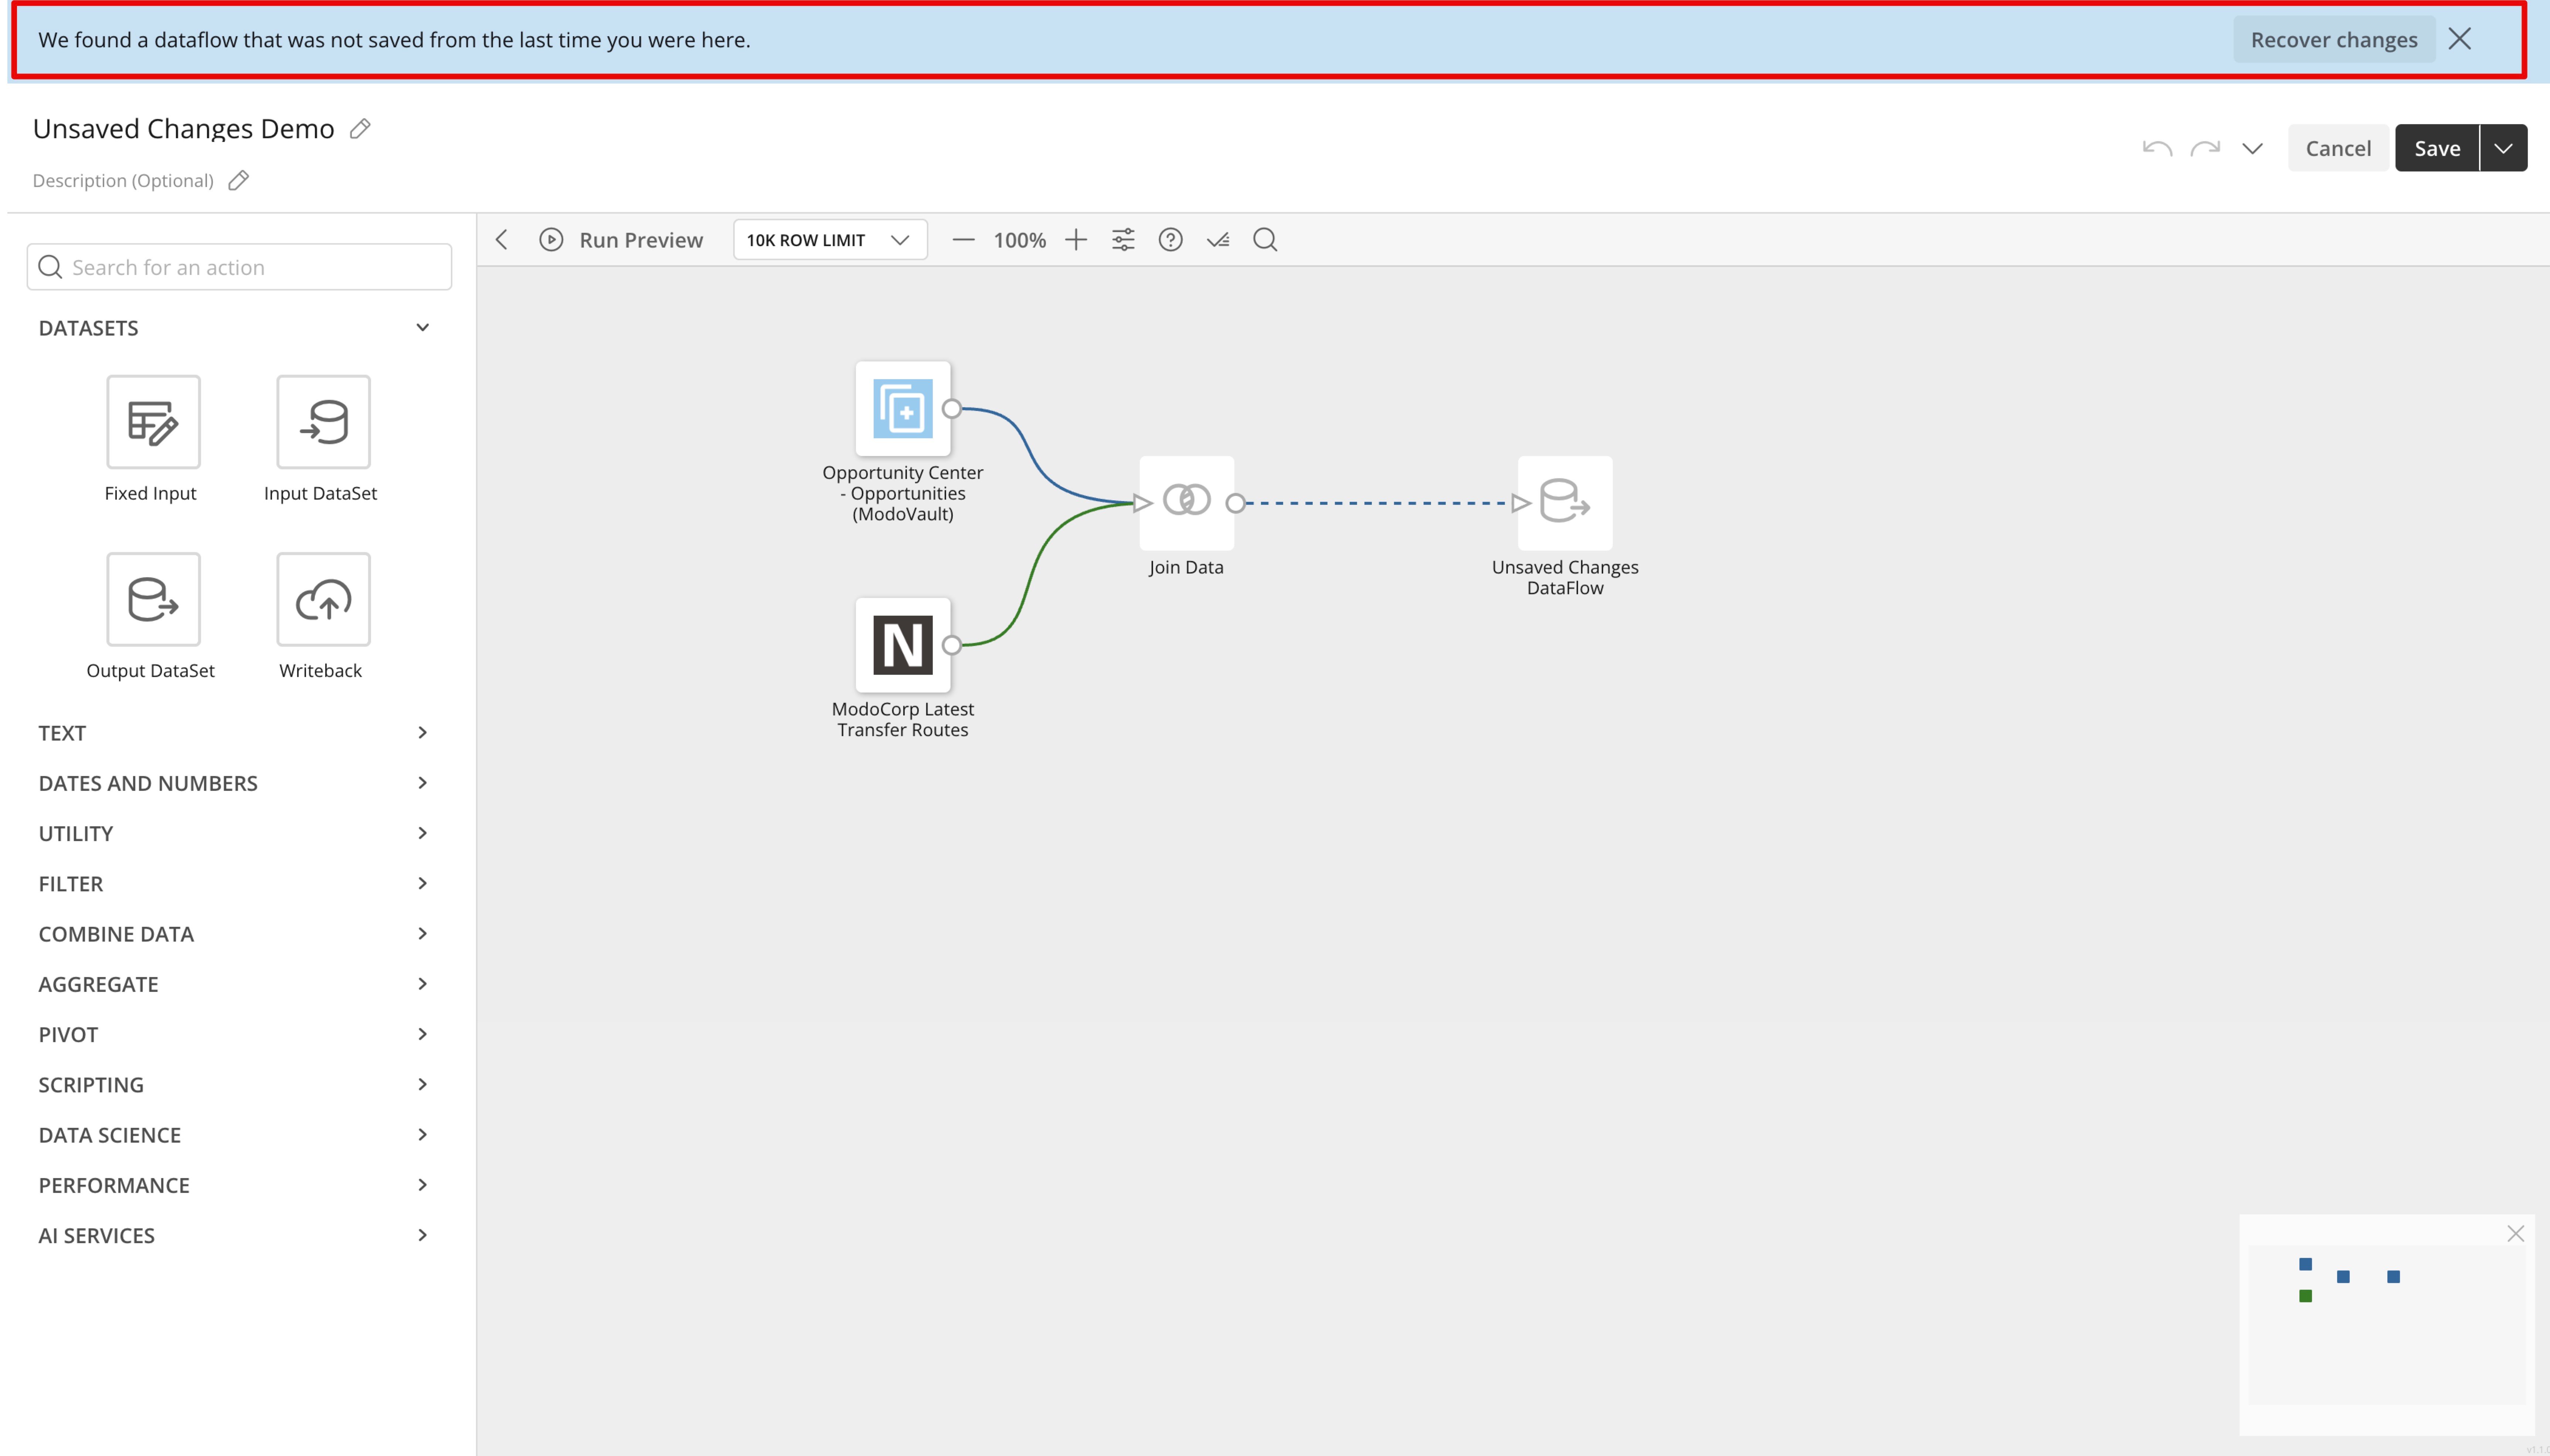 2. Select
**Recover changes** in the right of the banner.
Changes to your DataFlow are recovered.
**Important:**
If you accidentally close the blue banner without recovering changes, you lose those changes and cannot recover them.
**Note:**
Recovering unsaved changes to your DataFlow does not persist across browsers and is stored and encrypted in your local browser. You cannot see these changes from another computer or browser.
2. Select
**Recover changes** in the right of the banner.
Changes to your DataFlow are recovered.
**Important:**
If you accidentally close the blue banner without recovering changes, you lose those changes and cannot recover them.
**Note:**
Recovering unsaved changes to your DataFlow does not persist across browsers and is stored and encrypted in your local browser. You cannot see these changes from another computer or browser.