> ## Documentation Index
> Fetch the complete documentation index at: https://domoinc-openapi-sync-dataflows.mintlify.site/llms.txt
> Use this file to discover all available pages before exploring further.
# Create Segments in Analyzer
export const InlineImage = ({src, alt = '', height = '1.6em'}) => {
return  ;
};
### Intro
The Segments feature allows you to create better comparisons of a Segment versus another group. Additionally, you can dynamically filter one item without impacting the Segment and compare the results. You can add a Segment to any multi-series chart, period-over-period chart, or multi-value chart. You can also add Segments to the Card Details view of cards and dashboards.
***
### Required Grants
You must have the Edit DataSet grant to create Segments on a DataSet. Learn more about grants in [Managing Custom Roles](/s/article/360043438973).
### Create a Segment
Follow these steps to create a Segment. Segments are saved to the DataSet and can be reused on other cards.
1. Open a card in Analyzer.
2. In the toolbar, select
**Segments**.
;
};
### Intro
The Segments feature allows you to create better comparisons of a Segment versus another group. Additionally, you can dynamically filter one item without impacting the Segment and compare the results. You can add a Segment to any multi-series chart, period-over-period chart, or multi-value chart. You can also add Segments to the Card Details view of cards and dashboards.
***
### Required Grants
You must have the Edit DataSet grant to create Segments on a DataSet. Learn more about grants in [Managing Custom Roles](/s/article/360043438973).
### Create a Segment
Follow these steps to create a Segment. Segments are saved to the DataSet and can be reused on other cards.
1. Open a card in Analyzer.
2. In the toolbar, select
**Segments**.
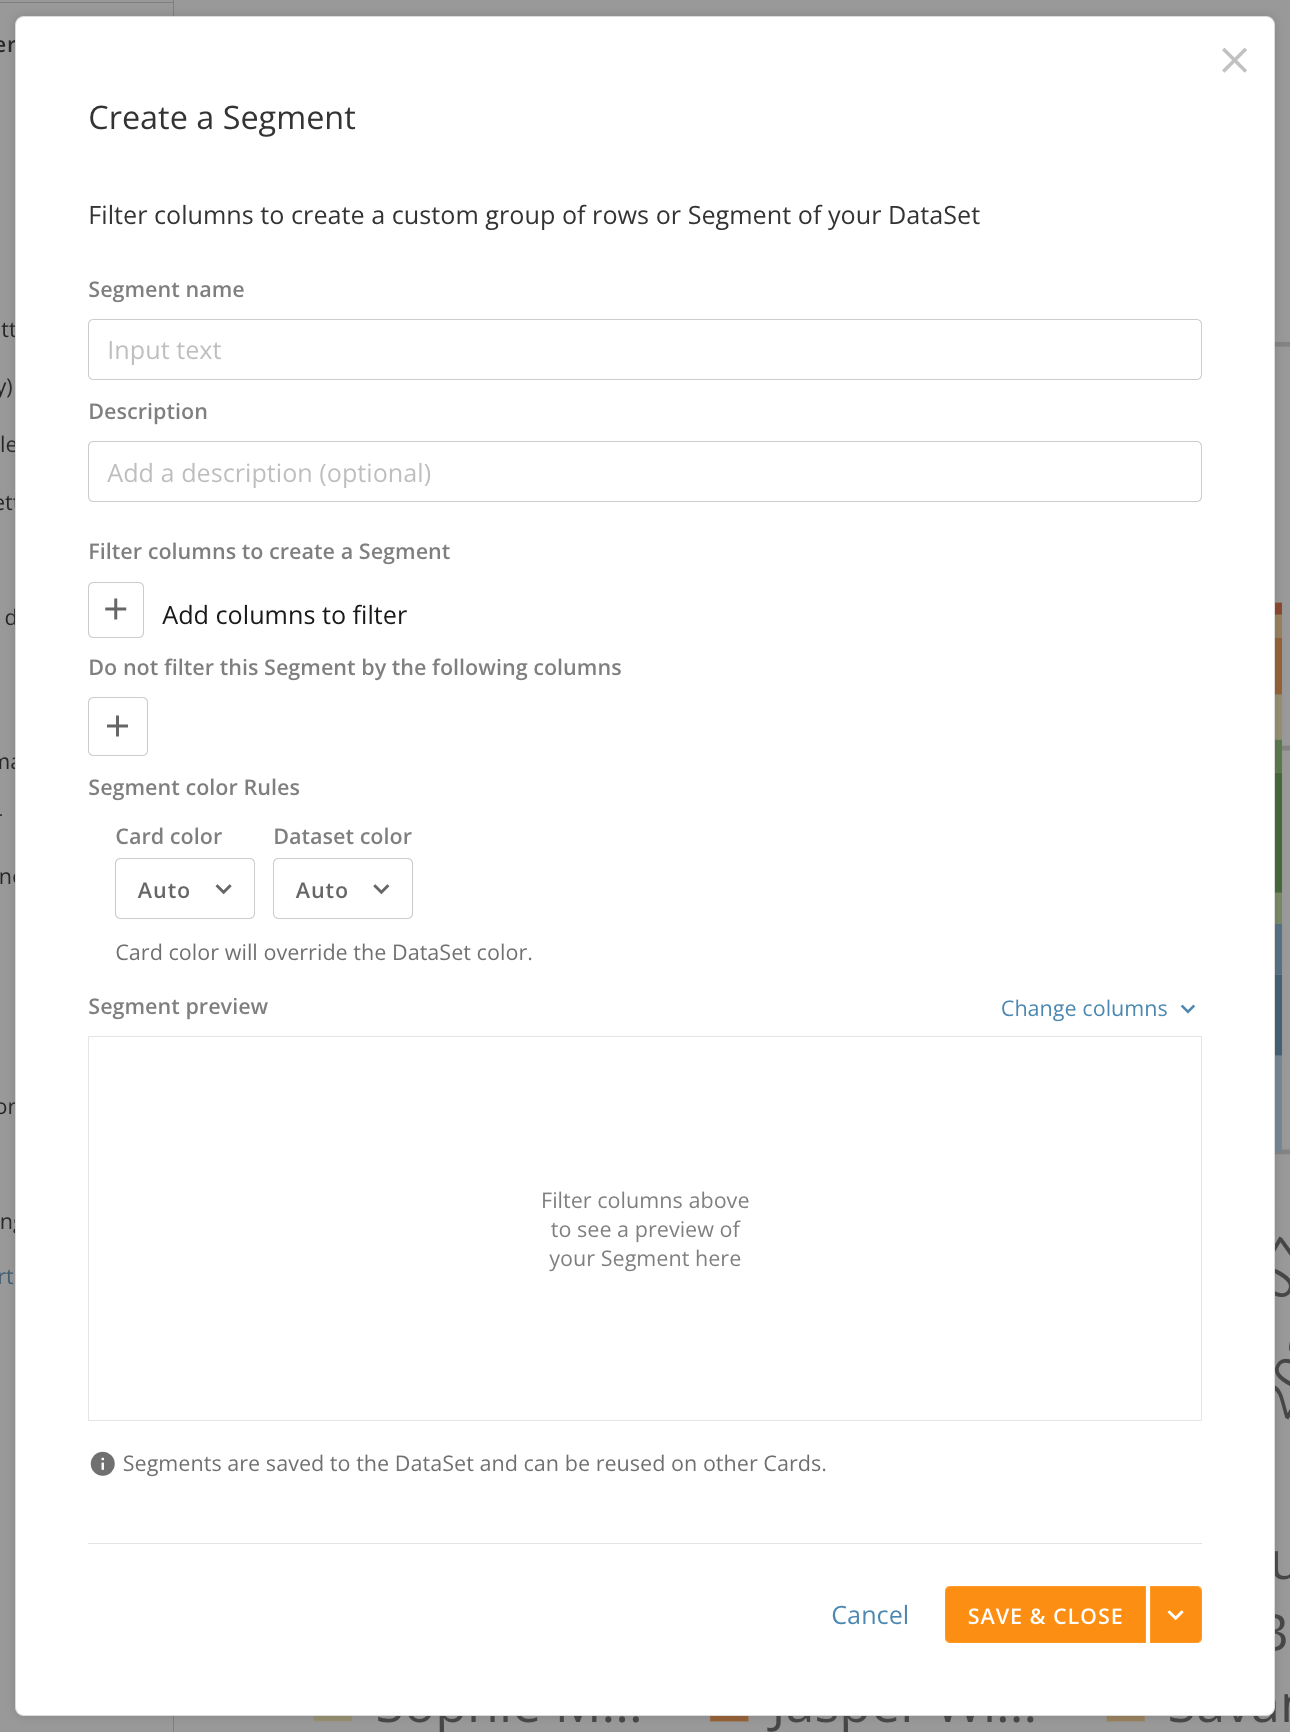
 The Segment creation modal displays.
 3. In the modal, enter a name in the
**Segment name** field. **Note:** The Segment name must match the item you are filtering in your data. For example, if you are selecting where the `Product` column equals "Toys", then you would name the Segment "Toys". Otherwise, your chart displays both the original data for "Toys" and the new Segment for "Toys" instead of the Segment replacing the existing data for "Toys."
4. (Optional) Enter information about the segment in the
**Description** field. This helps users determine what Segments to use if there are multiple on the DataSet.
5. Under
**Filter columns to create a Segment**, select to add columns to define and filter the Segment.
6. Select the value in the column by which you want to filter the Segment and select
**Apply**. Repeat steps 5 and 6 as needed. As you make changes, you can preview your Segment at the bottom of the modal.
7. Under
**Do not filter this segment by the following columns** **,** select columns that you do not want to filter the Segment. Repeat as needed. As you make changes, you can preview your Segment at the bottom of the modal.
8. (Optional) Under
**Segment color rules,** select a color from the **Card color** or **Dataset color** dropdown to apply color to the Segment. **Note:** The Segment always displays the DataSet color unless a card color has been set; card color overrides DataSet color. Card color only displays for this Segment on this particular card.
9. Select
**Save & Close** to save the Segment and close the model.
### Use Segments
**Notes:**
* Segments are saved to the DataSet. If you use a DataSet with Segments on a dashboard, the Segments option displays.
* You can save up to 20 segments to a DataSet.
# Use a Segment in a Card
1. Open the card for which you want to use a Segment in Analyzer.
2. In the left panel, in the
**Segments** tab, select the Segment you want to use.
3. Drag the Segment above the visualization beside the
**X axis**, **Y axis**, and **Series** areas.
4. Repeat steps 2 and 3 until all the desired Segments are added.
5. Save the card.
# Use a Segment in the Card Details View
When viewing the card Details for a card, if the DataSet has a Segment or Segments, you can go to the **Segments** tab and select up to three Segments at a time to display on the card.
# Use a Segment on a Dashboard
1. At the top of the dashboard where you want to use a Segment, locate the Filter Bar. To open it, select
**Show Page filters**. DataSets associated with the dashboard must have Segments already created. See how to [create a Segment](#create_segment) above.
3. In the modal, enter a name in the
**Segment name** field. **Note:** The Segment name must match the item you are filtering in your data. For example, if you are selecting where the `Product` column equals "Toys", then you would name the Segment "Toys". Otherwise, your chart displays both the original data for "Toys" and the new Segment for "Toys" instead of the Segment replacing the existing data for "Toys."
4. (Optional) Enter information about the segment in the
**Description** field. This helps users determine what Segments to use if there are multiple on the DataSet.
5. Under
**Filter columns to create a Segment**, select to add columns to define and filter the Segment.
6. Select the value in the column by which you want to filter the Segment and select
**Apply**. Repeat steps 5 and 6 as needed. As you make changes, you can preview your Segment at the bottom of the modal.
7. Under
**Do not filter this segment by the following columns** **,** select columns that you do not want to filter the Segment. Repeat as needed. As you make changes, you can preview your Segment at the bottom of the modal.
8. (Optional) Under
**Segment color rules,** select a color from the **Card color** or **Dataset color** dropdown to apply color to the Segment. **Note:** The Segment always displays the DataSet color unless a card color has been set; card color overrides DataSet color. Card color only displays for this Segment on this particular card.
9. Select
**Save & Close** to save the Segment and close the model.
### Use Segments
**Notes:**
* Segments are saved to the DataSet. If you use a DataSet with Segments on a dashboard, the Segments option displays.
* You can save up to 20 segments to a DataSet.
# Use a Segment in a Card
1. Open the card for which you want to use a Segment in Analyzer.
2. In the left panel, in the
**Segments** tab, select the Segment you want to use.
3. Drag the Segment above the visualization beside the
**X axis**, **Y axis**, and **Series** areas.
4. Repeat steps 2 and 3 until all the desired Segments are added.
5. Save the card.
# Use a Segment in the Card Details View
When viewing the card Details for a card, if the DataSet has a Segment or Segments, you can go to the **Segments** tab and select up to three Segments at a time to display on the card.
# Use a Segment on a Dashboard
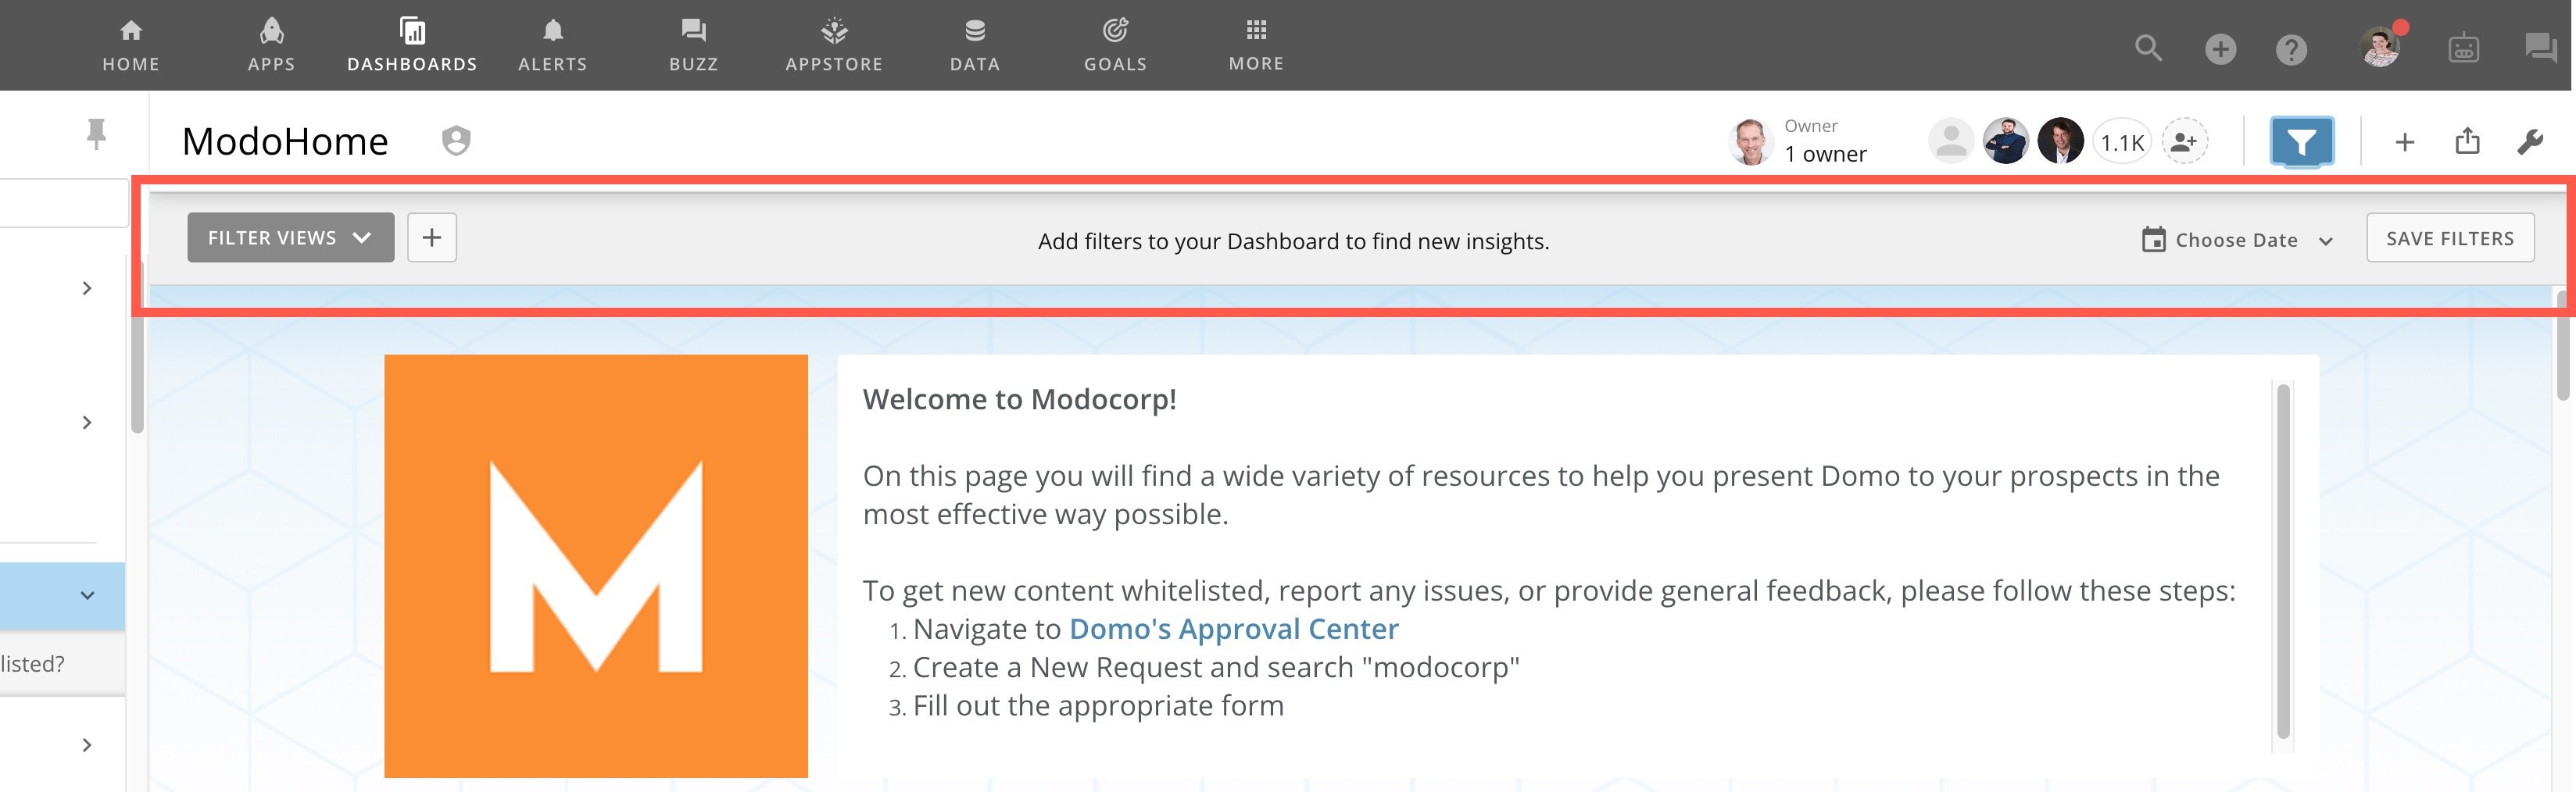
1. At the top of the dashboard where you want to use a Segment, locate the Filter Bar. To open it, select
**Show Page filters**. DataSets associated with the dashboard must have Segments already created. See how to [create a Segment](#create_segment) above.
 2. Select the
**Segments** dropdown.
2. Select the
**Segments** dropdown.
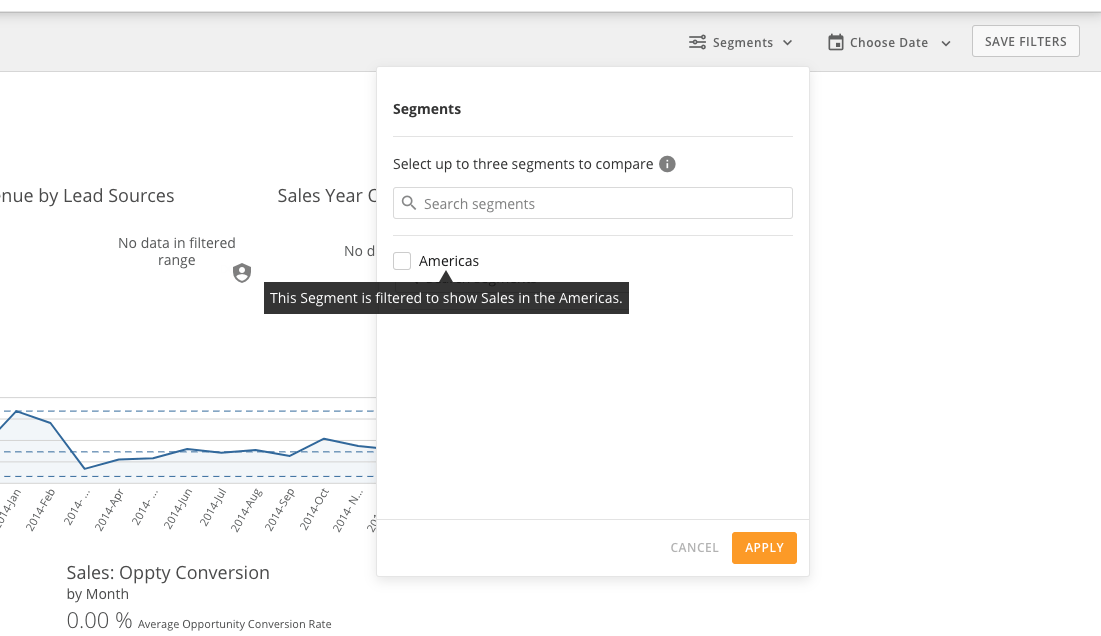
 3. Select the Segment(s) to apply to the dashboard. In the dropdown, hover over the Segment to display its description if applicable.
 4. Select
**Apply** to apply the selected Segments to the dashboard.
#### Disable Segments on a Dashboard
Follow these steps to disable Segments on a dashboard.
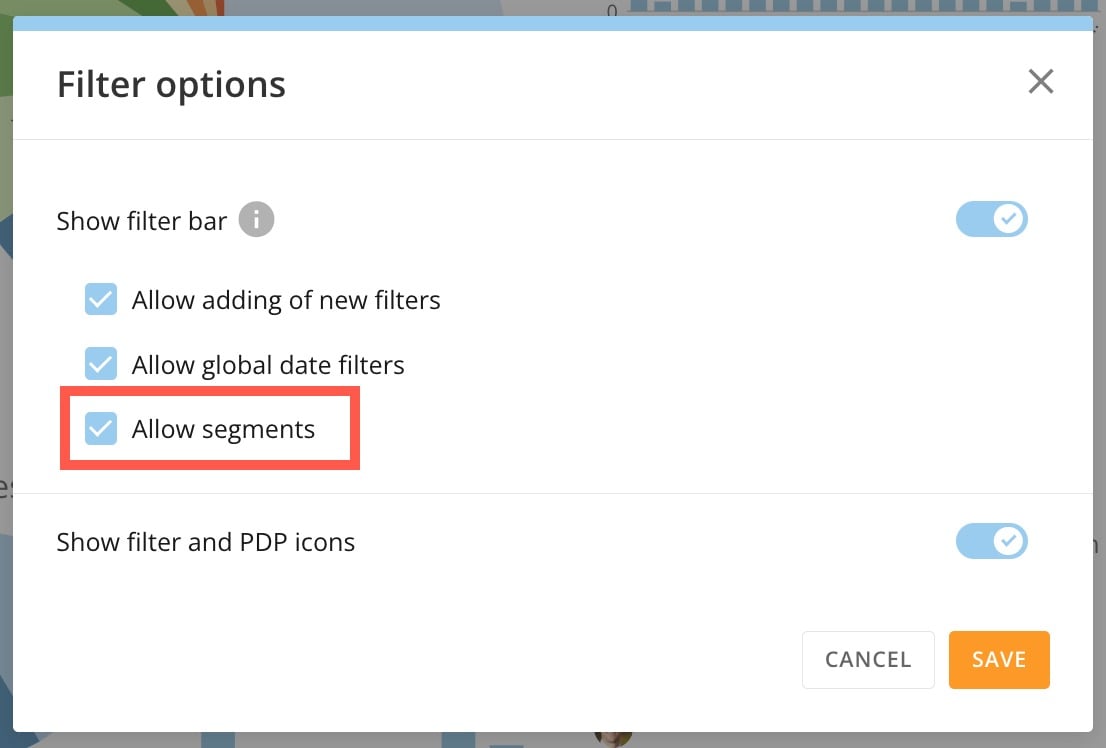
1. Select
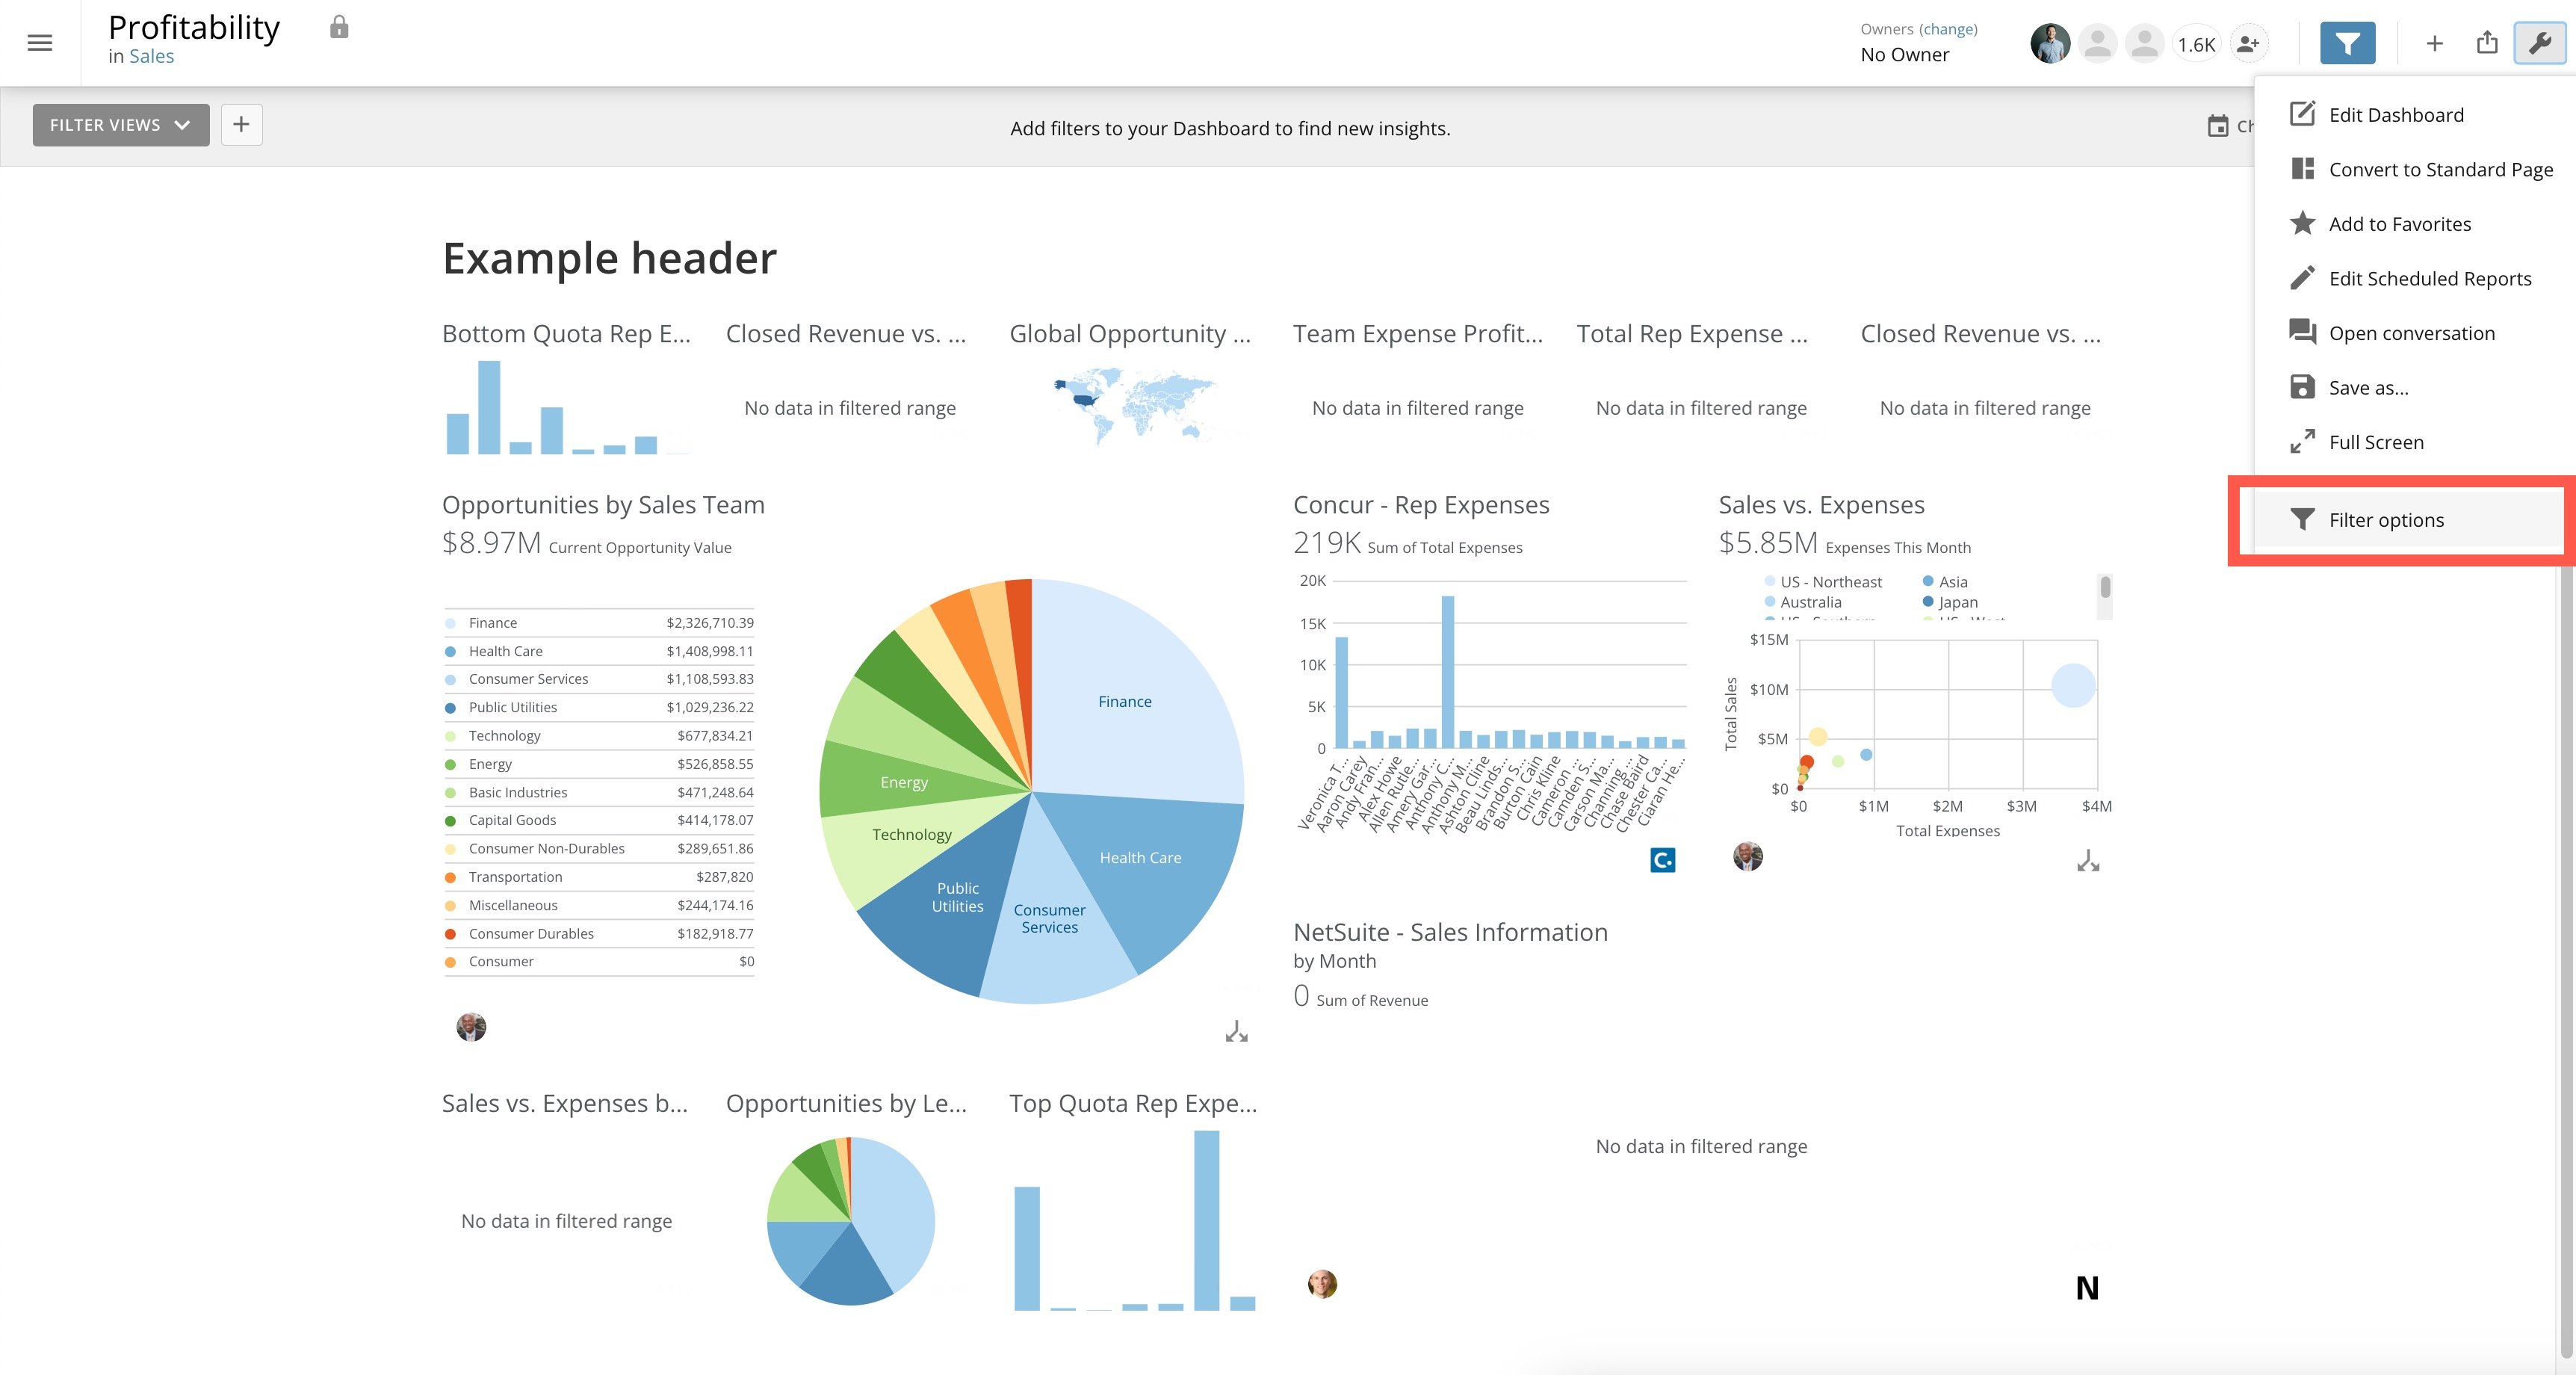
**Settings menu** > **Filter options**.
The **Filter options** modal displays.
4. Select
**Apply** to apply the selected Segments to the dashboard.
#### Disable Segments on a Dashboard
Follow these steps to disable Segments on a dashboard.
1. Select
**Settings menu** > **Filter options**.
The **Filter options** modal displays.
 2. In the modal, clear the
**Allow segments** checkbox.
2. In the modal, clear the
**Allow segments** checkbox.
 3. Select
**Save**.
### Segments (video)
3. Select
**Save**.
### Segments (video)