



> ## Documentation Index
> Fetch the complete documentation index at: https://domoinc-openapi-sync-dataflows.mintlify.site/llms.txt
> Use this file to discover all available pages before exploring further.

# Accessing Goals Data

export const InlineImage = ({src, alt = '', height = '1.6em'}) => {
  return <img noZoom src={src} alt={alt} style={{
    display: 'inline',
    verticalAlign: 'start',
    height: height,
    margin: '0'
  }} />;
};

### Intro

In Goals, you can see the overall status and progress of goals and metrics. With DomoStats, you can build reports and dashboards to analyze goal-related data.

### Access Goals

In the navigation, go to **Goals**.

### View Goal Status and Progress

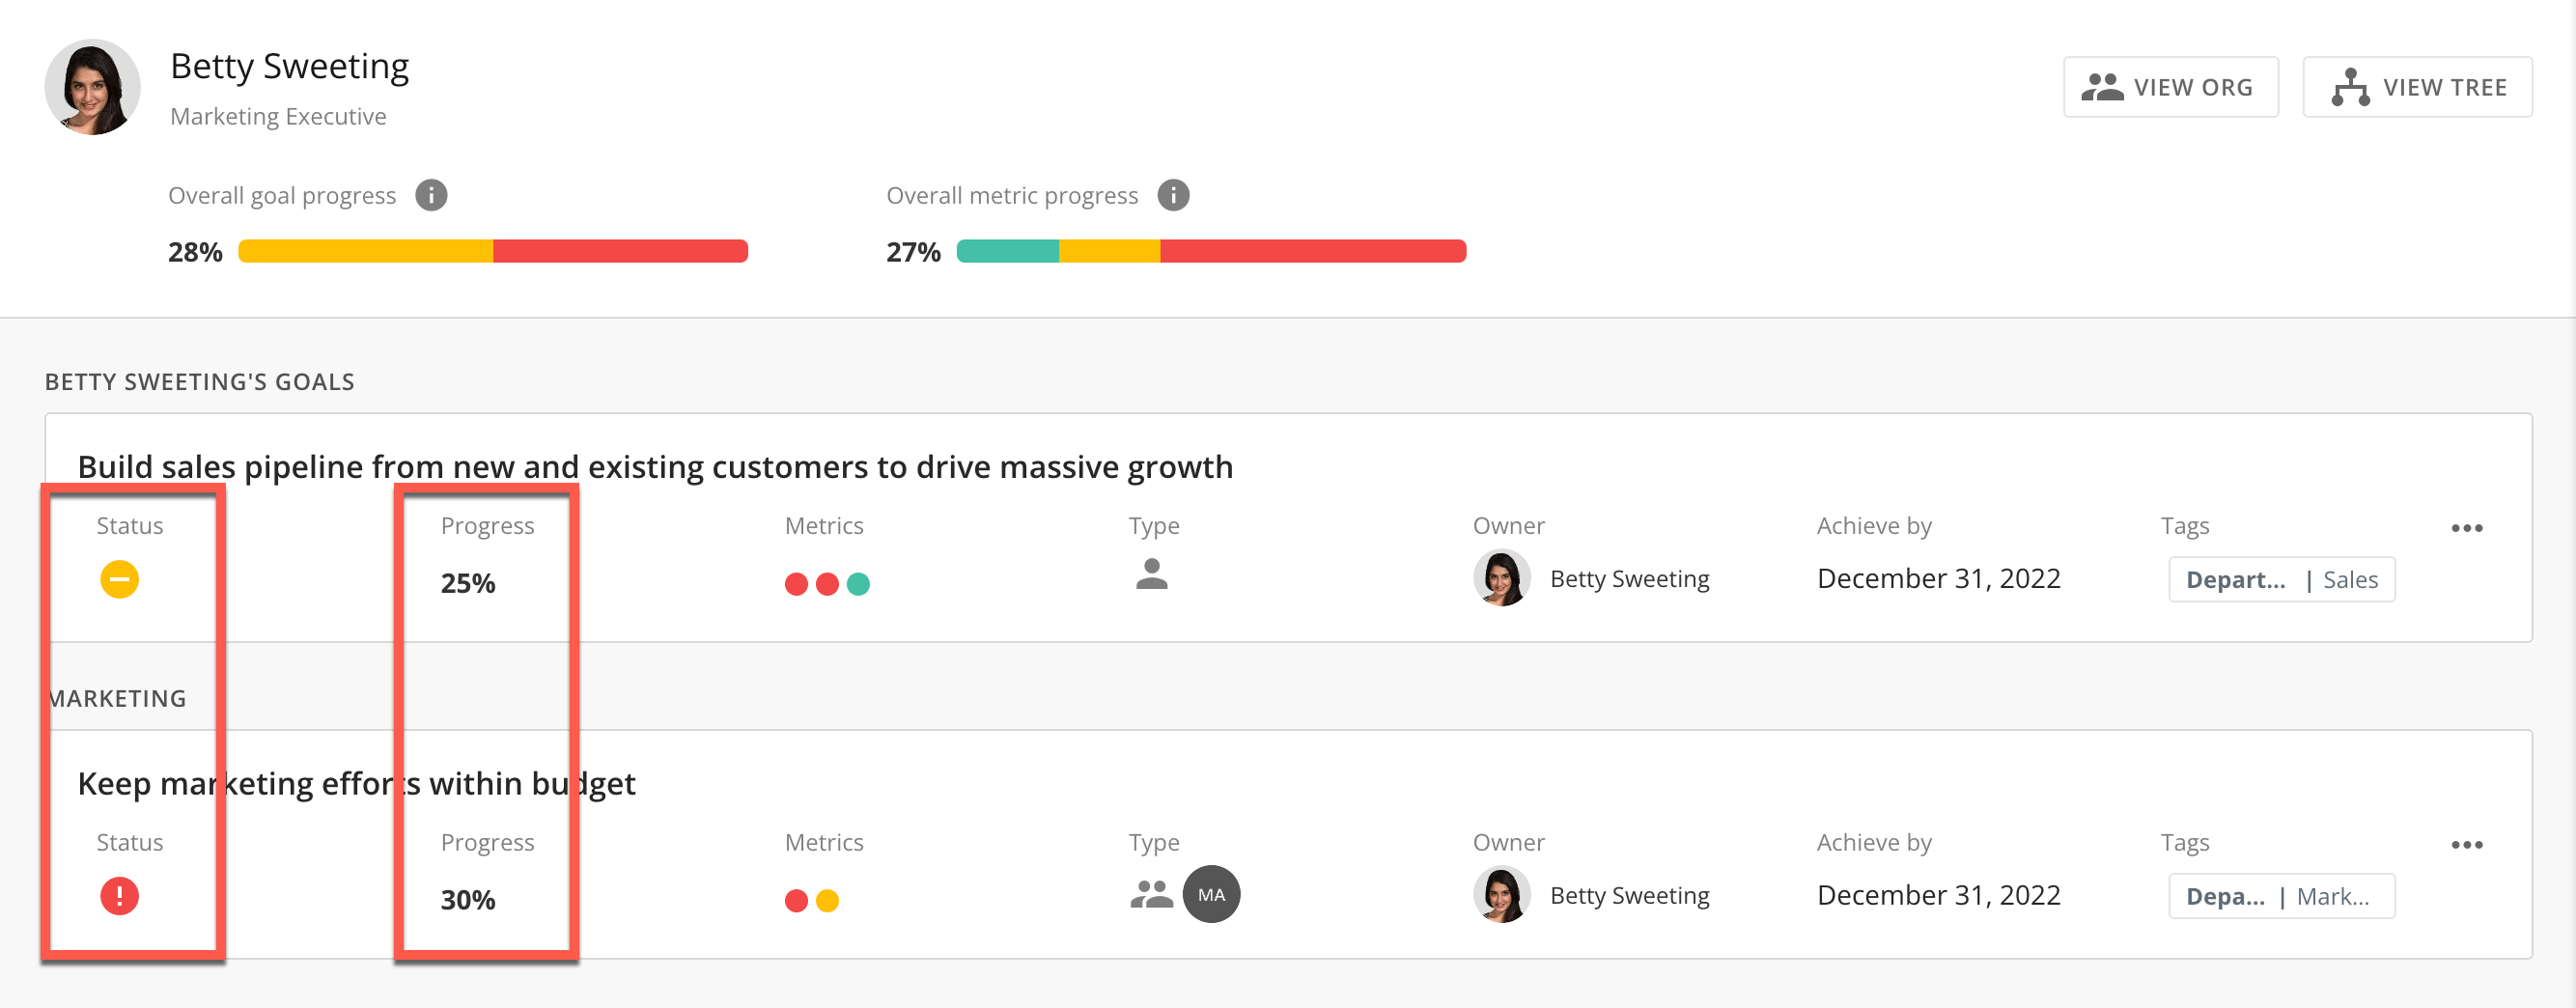
On the **Personal**, **Teams**, or **Company** pages, you can view the status and progress of each goal.

<Frame>
  <img alt="2022-09-14_16-11-44.png" src="https://mintcdn.com/domoinc-openapi-sync-dataflows/STh97d86twEaUU5_/images/kb/ka05w00000125IG-00N5w00000Ri7BU-0EM5w000005vOaT.png?fit=max&auto=format&n=STh97d86twEaUU5_&q=85&s=ac8784f3b3714aa9fd65a93a23f93d24" style={{width: 899, height: 352}} width="2668" height="1044" data-path="images/kb/ka05w00000125IG-00N5w00000Ri7BU-0EM5w000005vOaT.png" />
</Frame>

The summary banner displays your overall progress.

<Frame>
  <img alt="Screen_Shot_2022-09-14_at_4.17.05_PM.png" src="https://mintcdn.com/domoinc-openapi-sync-dataflows/STh97d86twEaUU5_/images/kb/ka05w00000125IG-00N5w00000Ri7BU-0EM5w000005vOaV.png?fit=max&auto=format&n=STh97d86twEaUU5_&q=85&s=a8bfc75cad81a925d14a499aa7809e57" style={{width: 900, height: 108}} width="2664" height="320" data-path="images/kb/ka05w00000125IG-00N5w00000Ri7BU-0EM5w000005vOaV.png" />
</Frame>

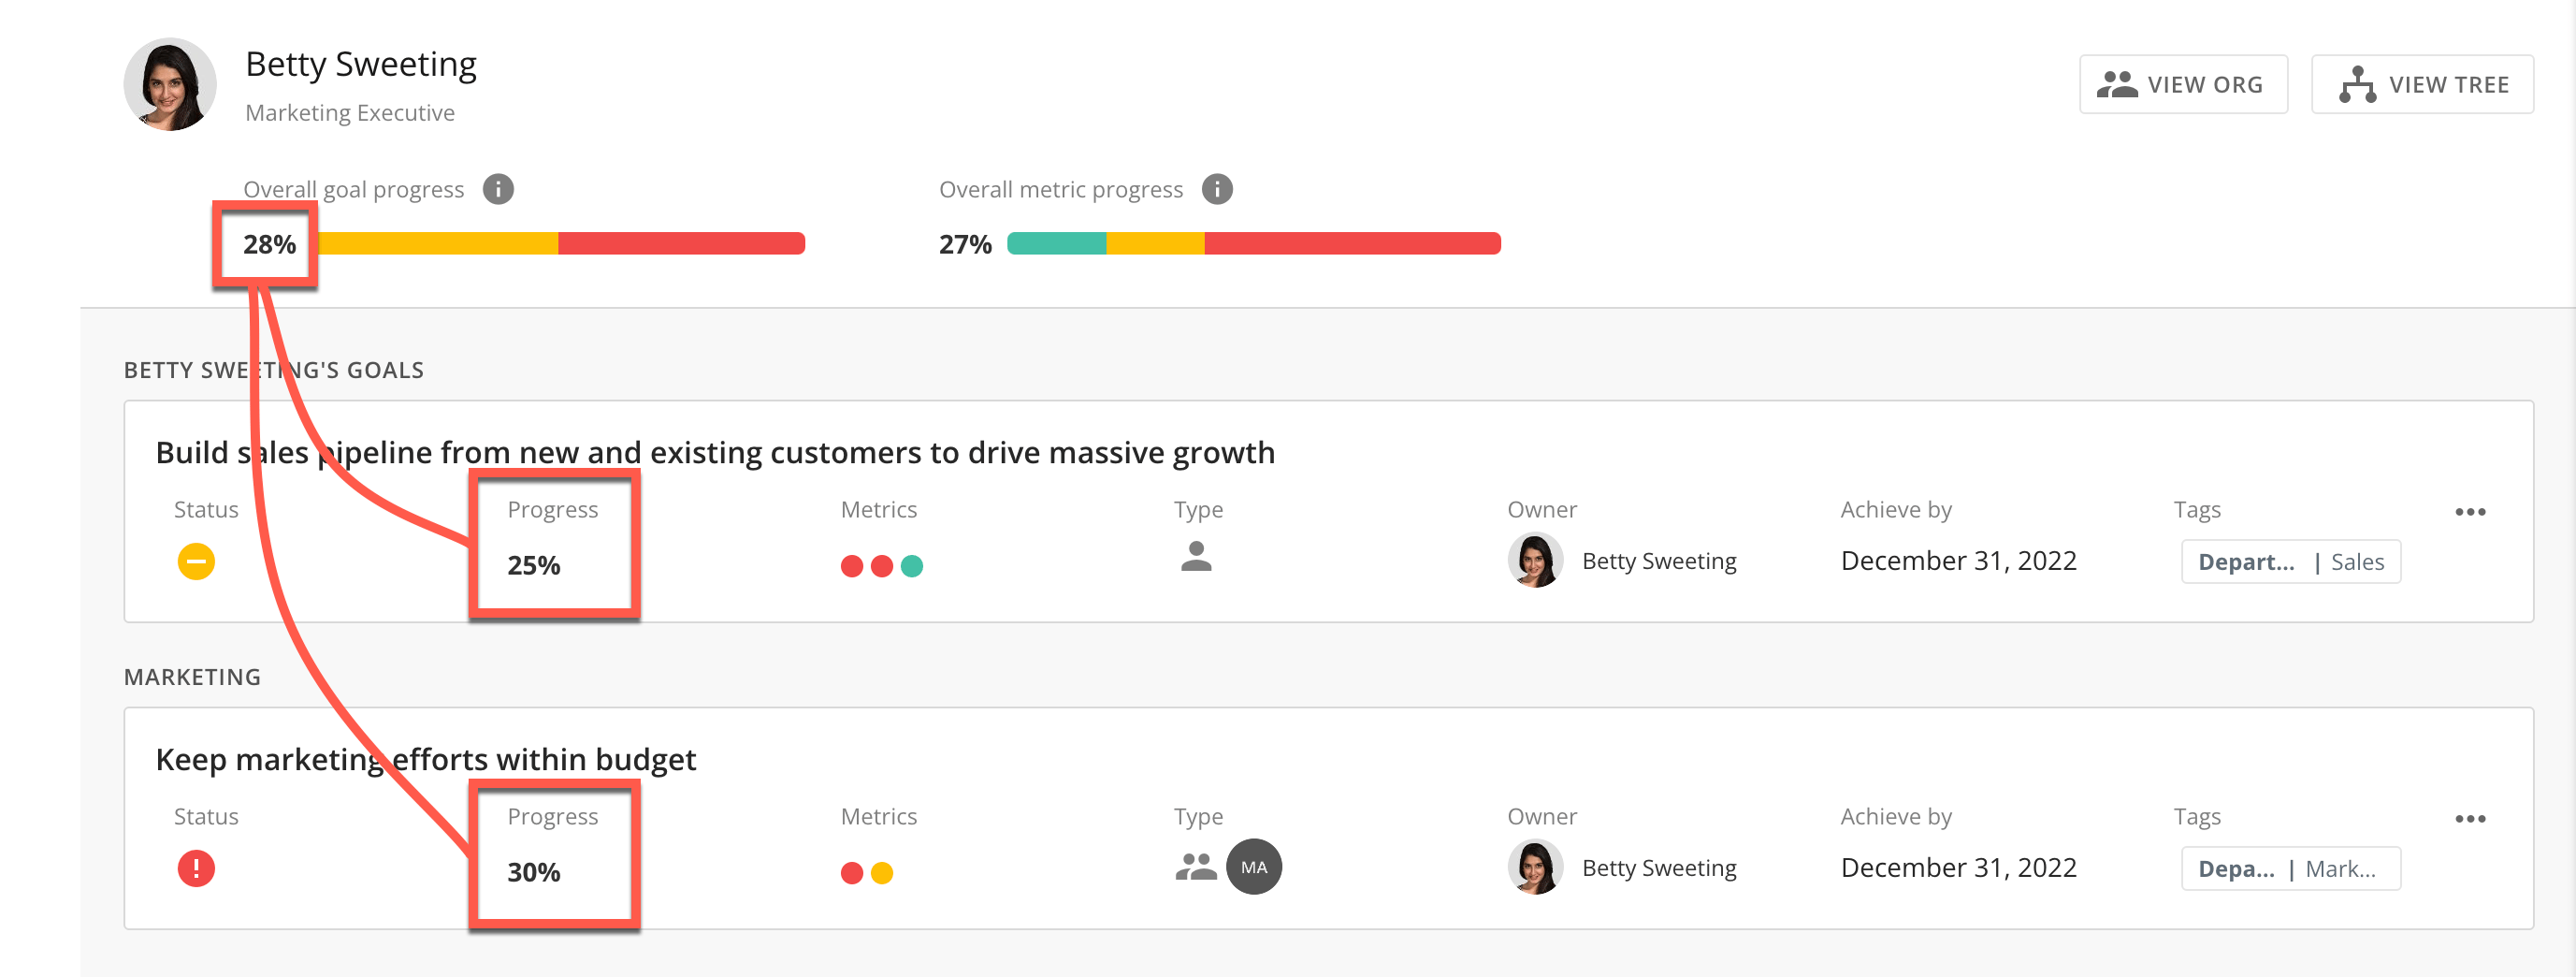
The **Overall Goal Progress** calculates the average progress of all of your goals in the current period. It also shows the distribution based on your goals' statuses.
<Note>
  **Note:**
  The Overall Goal Progress does not account for goals with a "Not Started" status.
</Note>

<Frame>
  <img alt="2022-09-14_16-11-44_copy_3.png" src="https://mintcdn.com/domoinc-openapi-sync-dataflows/STh97d86twEaUU5_/images/kb/ka05w00000125IG-00N5w00000Ri7BU-0EM5w000005vOag.png?fit=max&auto=format&n=STh97d86twEaUU5_&q=85&s=3a652c164bf9ce5dde1262884c3f9abc" style={{width: 899, height: 341}} width="2754" height="1044" data-path="images/kb/ka05w00000125IG-00N5w00000Ri7BU-0EM5w000005vOag.png" />
</Frame>

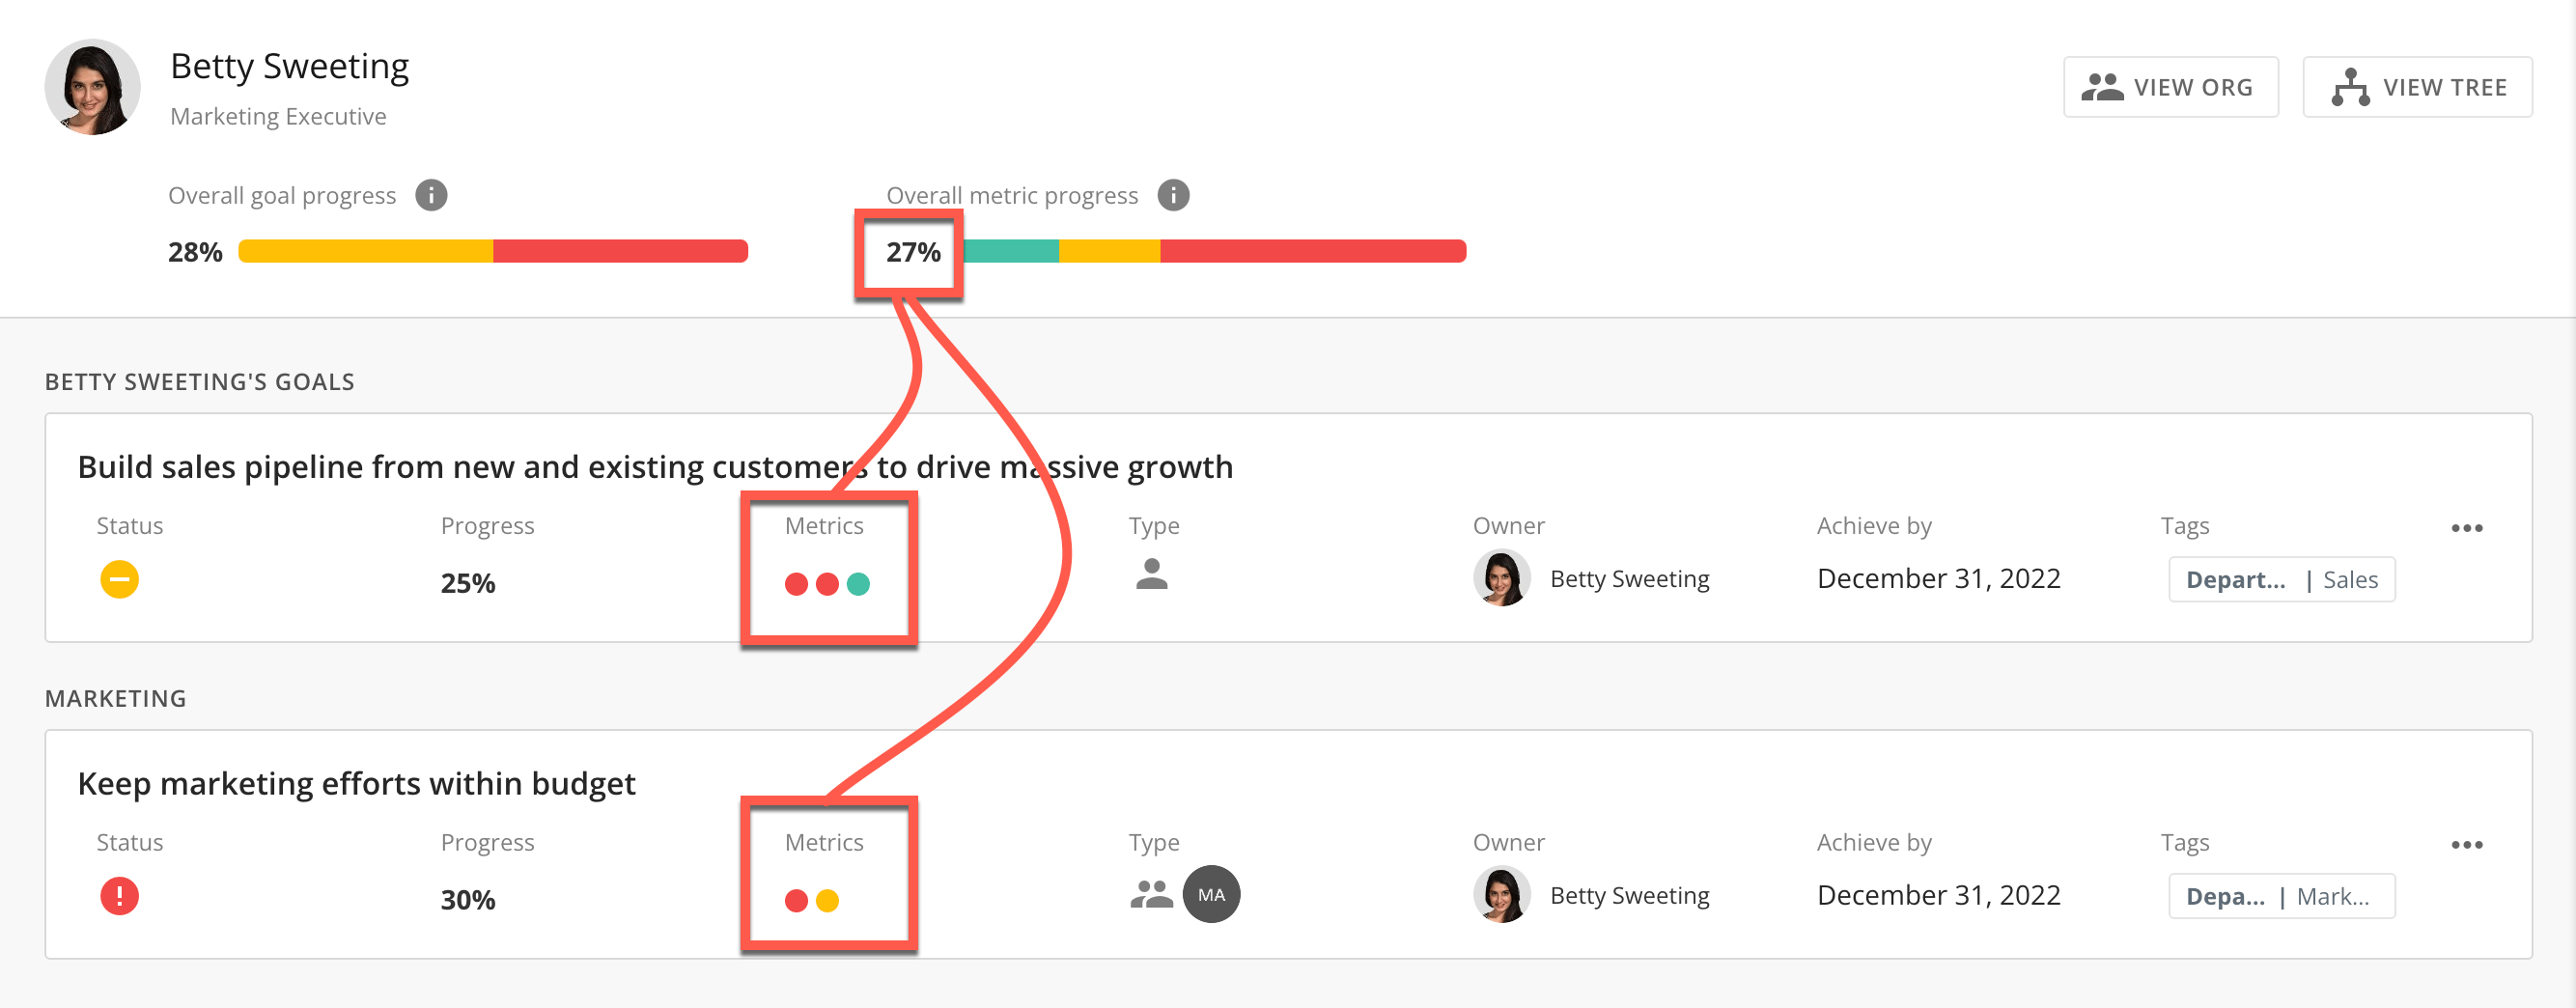
The **Average Metric Progress** calculates the average progress of all of your metrics in the current period. It also shows the distribution based on your metrics based on your organization's specified percentage ranges.
<Note>
  **Note:**
  Admins can choose percentage ranges for On Track, Needs Attention, and At Risk in
  **Admin**
  . For more information, see
  [Configuring Goals Settings](/s/article/4577172785559)
  .
</Note>

<Frame>
  <img alt="2022-09-14_16-11-44_copy_2.png" src="https://mintcdn.com/domoinc-openapi-sync-dataflows/STh97d86twEaUU5_/images/kb/ka05w00000125IG-00N5w00000Ri7BU-0EM5w000005vOaa.png?fit=max&auto=format&n=STh97d86twEaUU5_&q=85&s=56d7cbe14320b07d7fe5e781a0ed28a4" style={{width: 899, height: 352}} width="2668" height="1044" data-path="images/kb/ka05w00000125IG-00N5w00000Ri7BU-0EM5w000005vOaa.png" />
</Frame>

You can also view metric progress summaries by hovering over any colored dot. In this view, you can see the **Progress**, **Owner**, when the metric was **Last updated**, and the projected **Achieve by** date. To see more details, select the metric.

<Frame>
  <img alt="2022-09-14_17-16-35.png" src="https://mintcdn.com/domoinc-openapi-sync-dataflows/STh97d86twEaUU5_/images/kb/ka05w00000125IG-00N5w00000Ri7BU-0EM5w000005vOaS.png?fit=max&auto=format&n=STh97d86twEaUU5_&q=85&s=2842c92b8058312a3569a9fb3f46cdea" style={{width: 847, height: 115}} width="2638" height="358" data-path="images/kb/ka05w00000125IG-00N5w00000Ri7BU-0EM5w000005vOaS.png" />
</Frame>

Colored icons will indicate how individual goals and metrics are performing.

**Goal Status Key**

<Note>
  **Note:** If a goal's status is "Not Started," the progress is automatically set to 0% regardless of the underlying metric progress.
</Note>

<table border="1" data-aura-rendered-by="33:208;a"><tbody><tr><td class="wysiwyg-text-align-center" colspan="1" rowspan="1"><b> Icon </b></td><td class="wysiwyg-text-align-center" colspan="1" rowspan="1"><b> Status </b></td></tr><tr><td class="wysiwyg-text-align-center" colspan="1" rowspan="1"><img alt="Screen_Shot_2022-06-02_at_12.32.27_PM.png" src="https://mintcdn.com/domoinc-openapi-sync-dataflows/PXbqzJKMKWWuwcKY/images/kb/ka05w00000123aO-00N5w00000Ri7BU-0EM5w000005vOaF.png?fit=max&auto=format&n=PXbqzJKMKWWuwcKY&q=85&s=9d3b749eae20118b95f62a383cf88a00" width="116" height="106" data-path="images/kb/ka05w00000123aO-00N5w00000Ri7BU-0EM5w000005vOaF.png" /></td><td class="wysiwyg-text-align-center" colspan="1" rowspan="1"> On Track </td></tr><tr><td class="wysiwyg-text-align-center" colspan="1" rowspan="1"><img alt="Screen_Shot_2022-06-02_at_12.32.35_PM.png" src="https://mintcdn.com/domoinc-openapi-sync-dataflows/PXbqzJKMKWWuwcKY/images/kb/ka05w00000123aO-00N5w00000Ri7BU-0EM5w000005vOaH.png?fit=max&auto=format&n=PXbqzJKMKWWuwcKY&q=85&s=d2dfea915b1536e1a235b6b663392aa7" width="108" height="104" data-path="images/kb/ka05w00000123aO-00N5w00000Ri7BU-0EM5w000005vOaH.png" /></td><td class="wysiwyg-text-align-center" colspan="1" rowspan="1"> Needs Attention </td></tr><tr><td class="wysiwyg-text-align-center" colspan="1" rowspan="1"><img alt="Screen_Shot_2022-06-02_at_12.32.19_PM.png" src="https://mintcdn.com/domoinc-openapi-sync-dataflows/PXbqzJKMKWWuwcKY/images/kb/ka05w00000123aO-00N5w00000Ri7BU-0EM5w000005vOaN.png?fit=max&auto=format&n=PXbqzJKMKWWuwcKY&q=85&s=8f04175122faafe9aa5777d8dc20f461" style={{width: 121, height: 117}} width="120" height="116" data-path="images/kb/ka05w00000123aO-00N5w00000Ri7BU-0EM5w000005vOaN.png" /></td><td class="wysiwyg-text-align-center" colspan="1" rowspan="1"><p> At Risk </p></td></tr><tr><td class="wysiwyg-text-align-center" colspan="1" rowspan="1"><p /><p><img alt="Screen_Shot_2022-09-14_at_5.04.55_PM.png" src="https://mintcdn.com/domoinc-openapi-sync-dataflows/PXbqzJKMKWWuwcKY/images/kb/ka05w00000123aO-00N5w00000Ri7BU-0EM5w000005vOaA.png?fit=max&auto=format&n=PXbqzJKMKWWuwcKY&q=85&s=0590a4e19891b7917e0d1bb050d81f00" style={{width: 75, height: 63}} width="168" height="142" data-path="images/kb/ka05w00000123aO-00N5w00000Ri7BU-0EM5w000005vOaA.png" /></p><p /></td><td class="wysiwyg-text-align-center" colspan="1" rowspan="1"> Not Started </td></tr></tbody></table>

**Metric Progress Key**

<table border="1" data-aura-rendered-by="33:208;a"><tbody><tr><td class="wysiwyg-text-align-center" colspan="1" rowspan="1"><b> Icon </b></td><td class="wysiwyg-text-align-center" colspan="1" rowspan="1"><b> Status </b></td></tr><tr><td class="wysiwyg-text-align-center" colspan="1" rowspan="1"><img alt="Screen_Shot_2022-06-02_at_3.25.50_PM.png" src="https://mintcdn.com/domoinc-openapi-sync-dataflows/STh97d86twEaUU5_/images/kb/ka05w00000125IG-00N5w00000Ri7BU-0EM5w000005vOaR.png?fit=max&auto=format&n=STh97d86twEaUU5_&q=85&s=a53355f5ce383c879e0d4a39583eae68" style={{width: 65, height: 54}} width="190" height="158" data-path="images/kb/ka05w00000125IG-00N5w00000Ri7BU-0EM5w000005vOaR.png" /></td><td class="wysiwyg-text-align-center" colspan="1" rowspan="1"> Between 70% and 100% complete </td></tr><tr><td class="wysiwyg-text-align-center" colspan="1" rowspan="1"><img alt="Screen_Shot_2022-06-02_at_3.27.04_PM.png" src="https://mintcdn.com/domoinc-openapi-sync-dataflows/STh97d86twEaUU5_/images/kb/ka05w00000125IG-00N5w00000Ri7BU-0EM5w000005vOai.png?fit=max&auto=format&n=STh97d86twEaUU5_&q=85&s=e109d7264dd4d4b4e62a3539a0623692" style={{width: 63, height: 60}} width="120" height="114" data-path="images/kb/ka05w00000125IG-00N5w00000Ri7BU-0EM5w000005vOai.png" /></td><td class="wysiwyg-text-align-center" colspan="1" rowspan="1"> Between 40% and 69% complete </td></tr><tr><td class="wysiwyg-text-align-center" colspan="1" rowspan="1"><img alt="Screen_Shot_2022-06-02_at_3.27.25_PM.png" src="https://mintcdn.com/domoinc-openapi-sync-dataflows/STh97d86twEaUU5_/images/kb/ka05w00000125IG-00N5w00000Ri7BU-0EM5w000005vOaf.png?fit=max&auto=format&n=STh97d86twEaUU5_&q=85&s=7ad4ebe137f66384f20d69c0a9d7ae56" style={{width: 63, height: 55}} width="366" height="316" data-path="images/kb/ka05w00000125IG-00N5w00000Ri7BU-0EM5w000005vOaf.png" /></td><td class="wysiwyg-text-align-center" colspan="1" rowspan="1"> Between 0% and 39% complete </td></tr><tr><td class="wysiwyg-text-align-center" colspan="1" rowspan="1"><InlineImage src="/images/kb/ka05w00000125IG-00N5w00000Ri7BU-0EM5w000005vOaQ.png" /></td><td class="wysiwyg-text-align-center" colspan="1" rowspan="1"> Metric has a future Start Date </td></tr></tbody></table>

### Connect with DomoStats

DomoStats is a connector that gives you a comprehensive view of your Domo instances, including Goals data. You can use DomoStats DataSets to view raw data about your organization's goals. With this raw data, you can create DataFlows with Magic ETL and create visualizations in Analyzer. This section describes how to connect to your Goals data in DomoStats. For more information, see the OKR Key Results DataSet or OKR Objectives DataSet sections of the [DomoStats Connector.](/s/article/360043433813)

1. In the navigation header, select
   **Data**.

<Frame>
  <img alt="2022-08-11_16-33-17.png" src="https://mintcdn.com/domoinc-openapi-sync-dataflows/STh97d86twEaUU5_/images/kb/ka05w00000125IG-00N5w00000Ri7BU-0EM5w000005vOaX.png?fit=max&auto=format&n=STh97d86twEaUU5_&q=85&s=56f0a37ea8bcaf83af769784511e4268" width="990" height="76" data-path="images/kb/ka05w00000125IG-00N5w00000Ri7BU-0EM5w000005vOaX.png" />
</Frame>

2. From the
   **Connect Data** options, select **Connectors**.

<Frame>
  <img alt="2022-08-11_16-34-13.png" src="https://mintcdn.com/domoinc-openapi-sync-dataflows/STh97d86twEaUU5_/images/kb/ka05w00000125IG-00N5w00000Ri7BU-0EM5w000005vOah.png?fit=max&auto=format&n=STh97d86twEaUU5_&q=85&s=612e502aef78eb2a2a472814a26d010e" style={{width: 602, height: 80}} width="766" height="102" data-path="images/kb/ka05w00000125IG-00N5w00000Ri7BU-0EM5w000005vOah.png" />
</Frame>

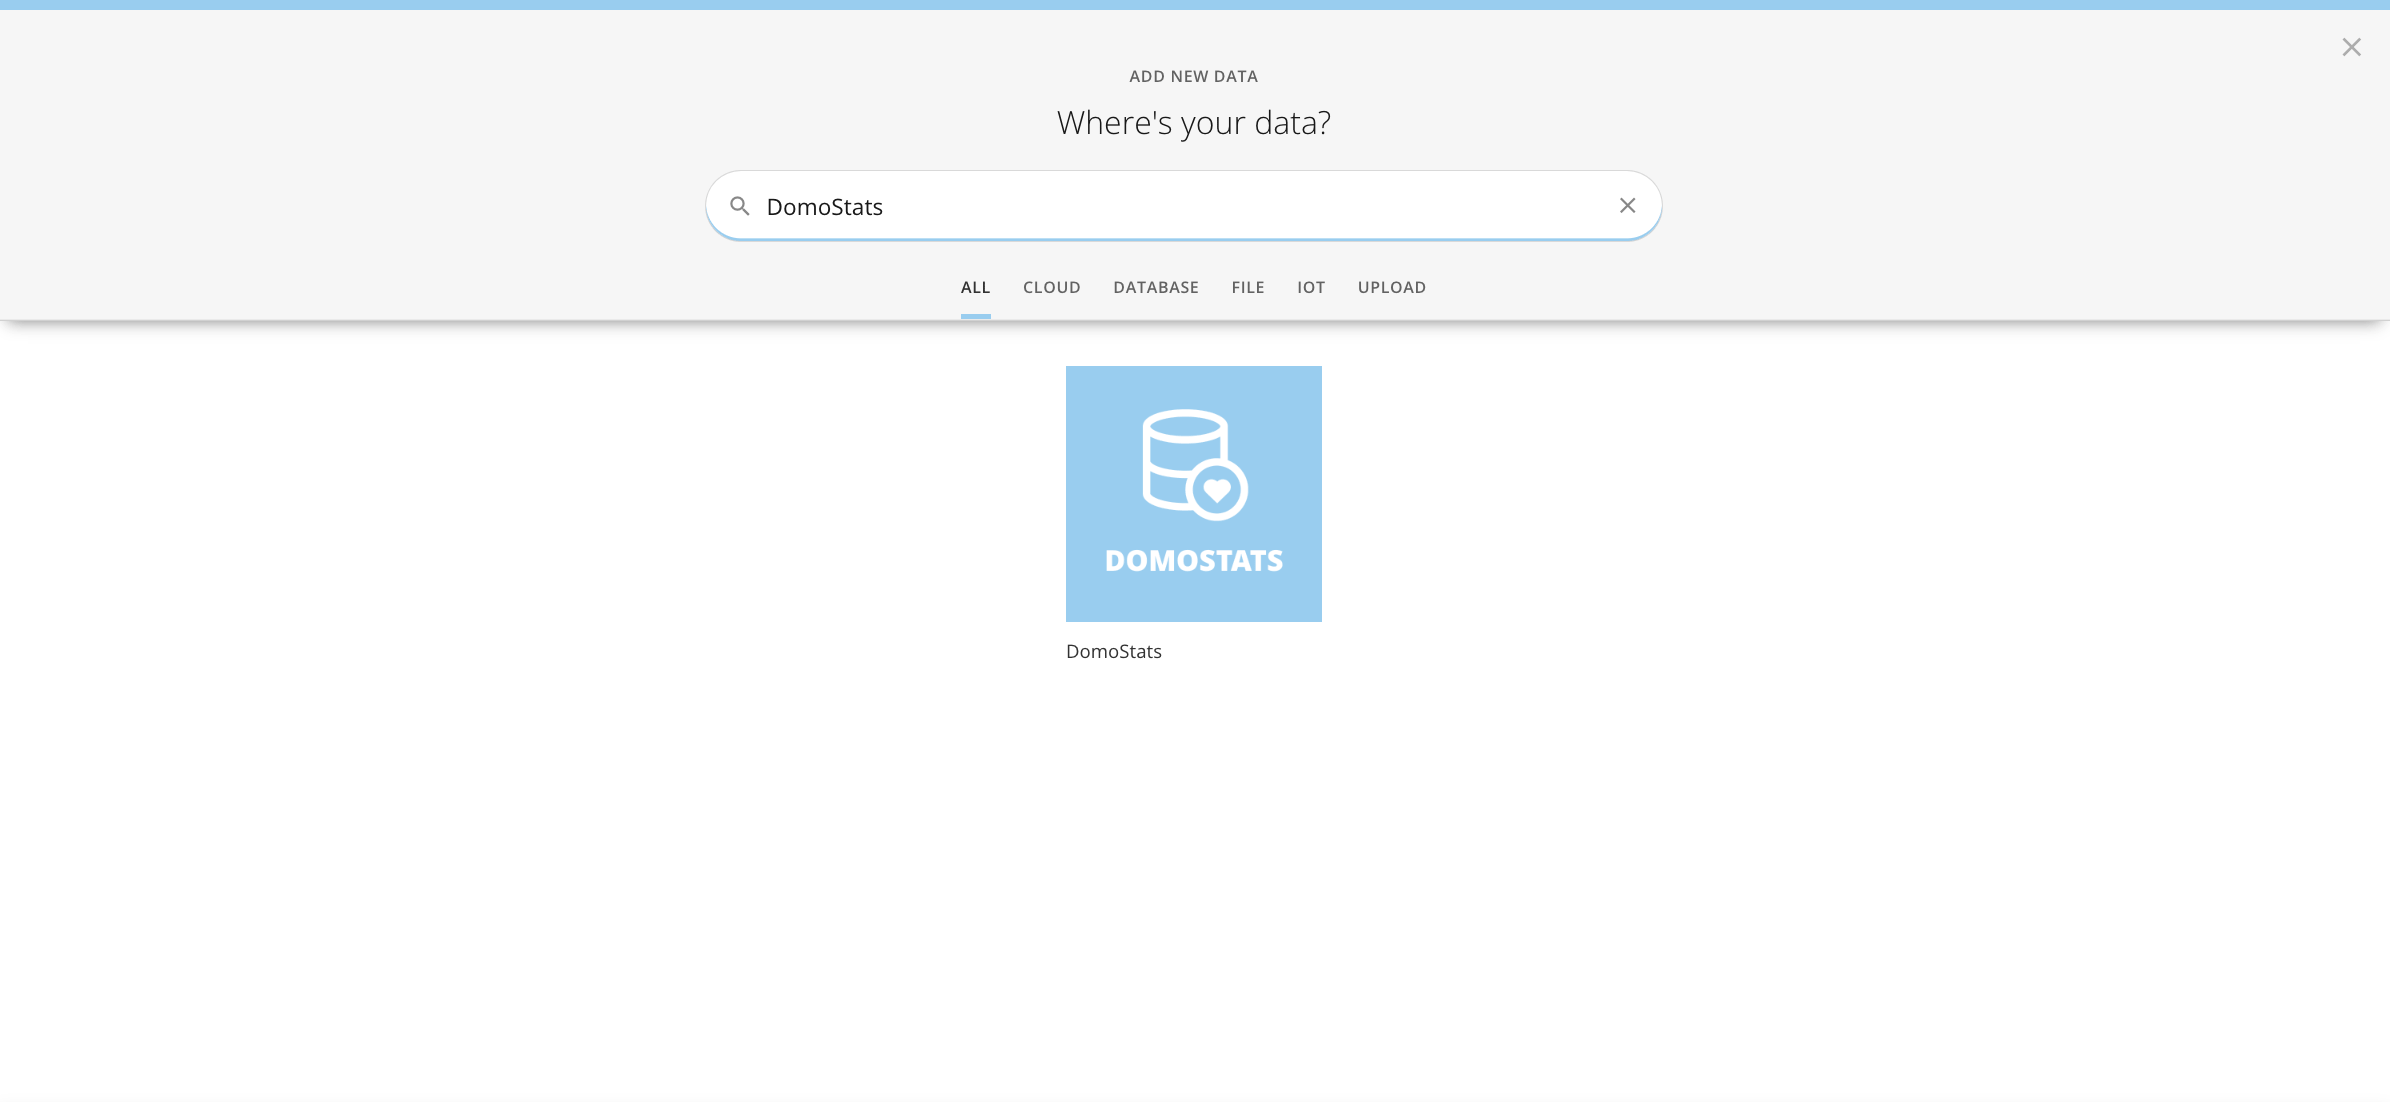
3. Enter DomoStats in the search field. Select
   **DomoStats**.
<Frame>
  <img alt="Screen_Shot_2022-08-11_at_4.34.50_PM.png" src="https://mintcdn.com/domoinc-openapi-sync-dataflows/STh97d86twEaUU5_/images/kb/ka05w00000125IG-00N5w00000Ri7BU-0EM5w000005vOaW.png?fit=max&auto=format&n=STh97d86twEaUU5_&q=85&s=daa18b8a8de3f6b36b2dee60ff71623d" style={{width: 898, height: 414}} width="2390" height="1102" data-path="images/kb/ka05w00000125IG-00N5w00000Ri7BU-0EM5w000005vOaW.png" />
</Frame>

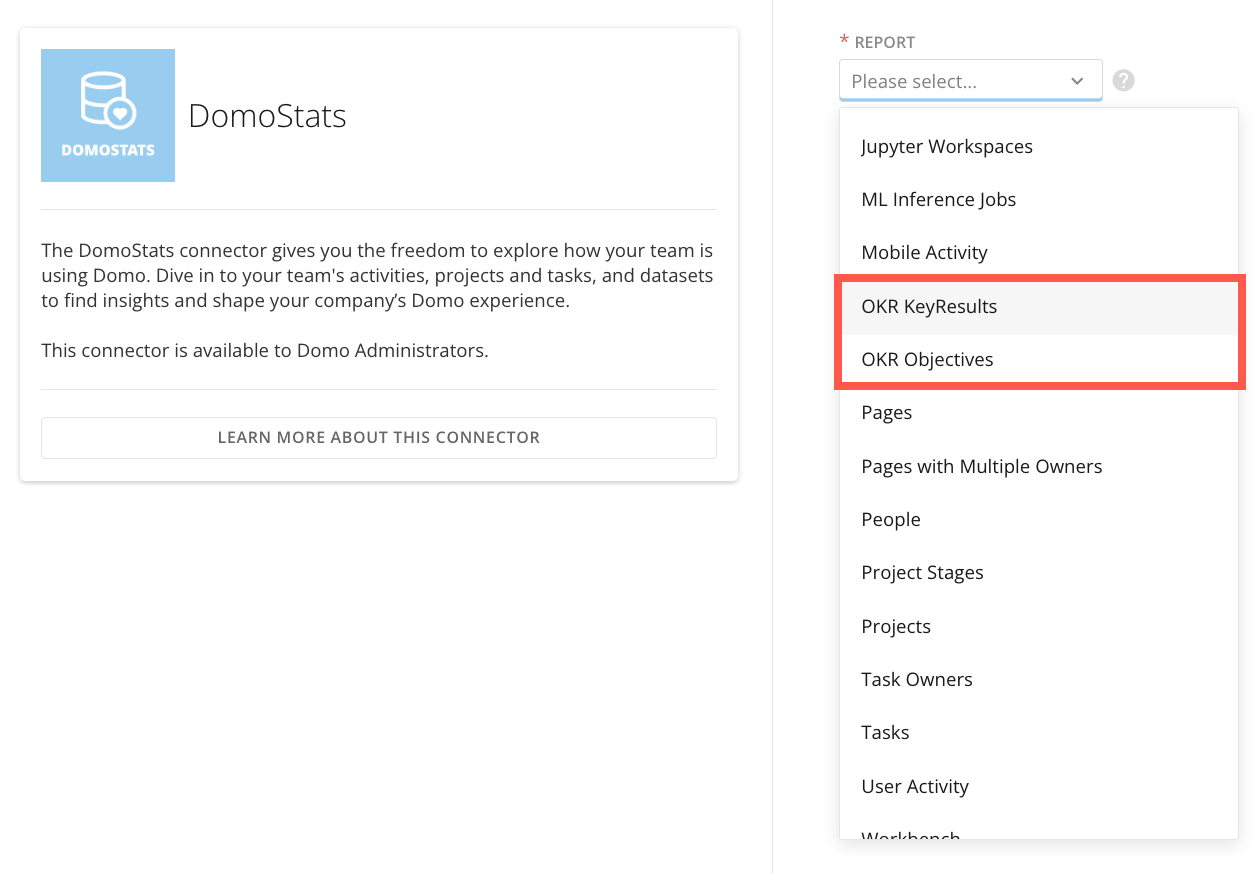
4. From the Report menu, choose either
   **OKR Objectives** or **OKR Key Results.** Select **Next.**

Each option will generate a report based on your selection. OKR Objectives will display data for Goals, and OKR Key Results will display data for Metrics.
<Frame>
  <img alt="2022-08-11_16-35-59.png" src="https://mintcdn.com/domoinc-openapi-sync-dataflows/STh97d86twEaUU5_/images/kb/ka05w00000125IG-00N5w00000Ri7BU-0EM5w000005vOac.png?fit=max&auto=format&n=STh97d86twEaUU5_&q=85&s=32944efe333a06bf4de30b62363b2000" style={{width: 532, height: 371}} width="1254" height="874" data-path="images/kb/ka05w00000125IG-00N5w00000Ri7BU-0EM5w000005vOac.png" />
</Frame>

6. Determine a schedule for when the DataSet will update and select
   **Next**.

7. Choose a name and optional description for your DataSet. Select
   **Save and Run.**

The **Overview** page displays.

8. Select
   **Data** from the tab bar.

After the connector finishes running, the raw data will be viewable in the **Data** tab. You can search for a goal or key result by filtering on the **Name** column.

<Frame>
  <img alt="Screen_Shot_2022-07-19_at_2.01.17_PM.png" src="https://mintcdn.com/domoinc-openapi-sync-dataflows/STh97d86twEaUU5_/images/kb/ka05w00000125IG-00N5w00000Ri7BU-0EM5w000005vOab.png?fit=max&auto=format&n=STh97d86twEaUU5_&q=85&s=2ca7fbaf374a6d4c059dc3873dc10791" width="910" height="98" data-path="images/kb/ka05w00000125IG-00N5w00000Ri7BU-0EM5w000005vOab.png" />
</Frame>

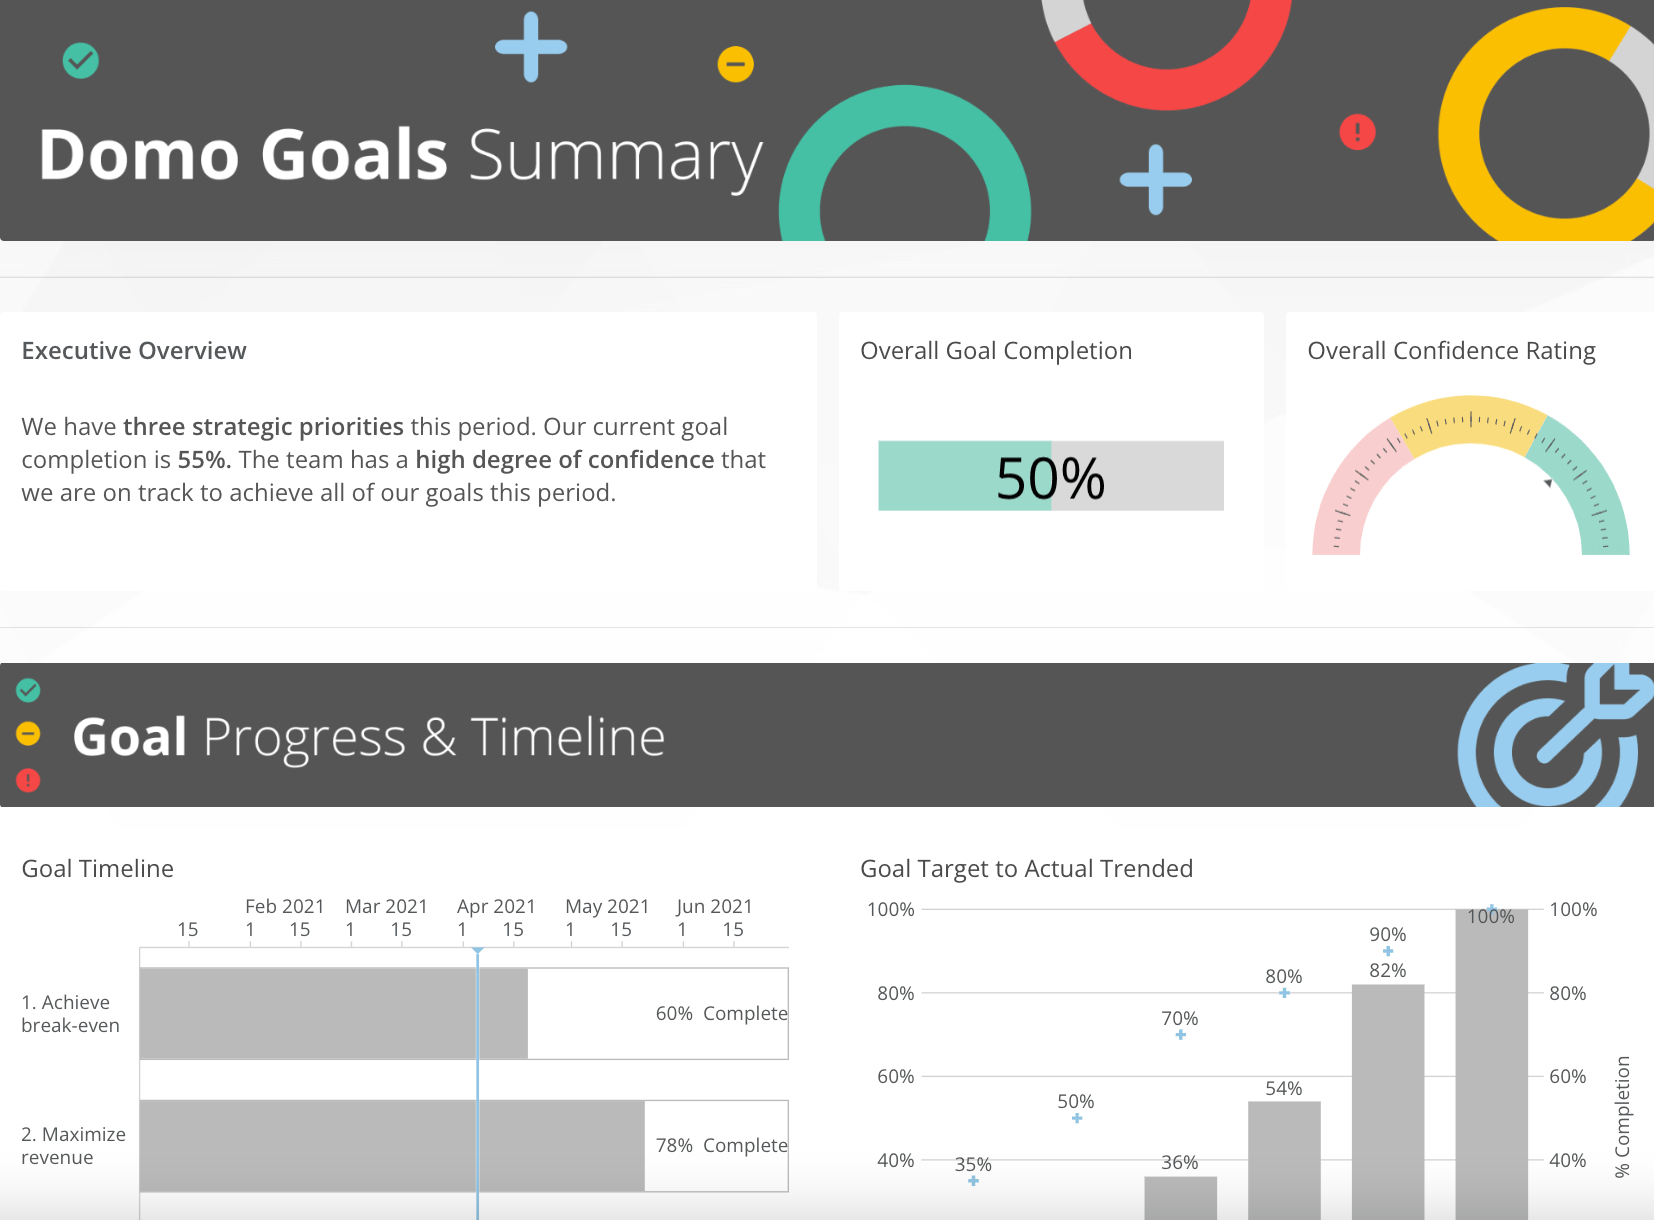
All of the data related to Domo Goals is stored in the DomoStats DataSets. This data can be made into visualizations as well as transformed using MagicETL DataFlow. The image below shows an example dashboard created to display a summary of the company's goals:
<Frame>
  <img alt="Screen_Shot_2022-08-11_at_6.24.48_PM.png" src="https://mintcdn.com/domoinc-openapi-sync-dataflows/STh97d86twEaUU5_/images/kb/ka05w00000125IG-00N5w00000Ri7BU-0EM5w000005vOaY.png?fit=max&auto=format&n=STh97d86twEaUU5_&q=85&s=b7b06c8fa5ed0dbb7c2faf0b2c6b7eef" style={{width: 899, height: 663}} width="1654" height="1220" data-path="images/kb/ka05w00000125IG-00N5w00000Ri7BU-0EM5w000005vOaY.png" />
</Frame>