> ## Documentation Index
> Fetch the complete documentation index at: https://domoinc-openapi-sync-dataflows.mintlify.site/llms.txt
> Use this file to discover all available pages before exploring further.

# Risk Heat Map

## Intro

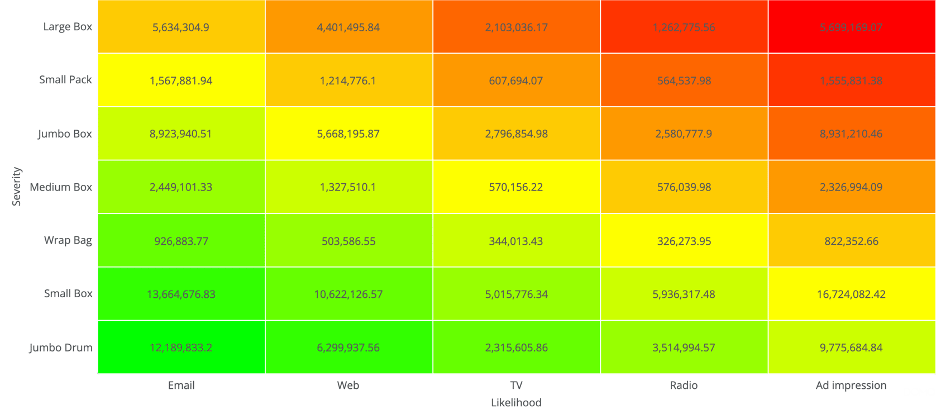
A risk heat map is a special type of heat map you can use to present the results of a risk assessment process visually  Whether conducted as part of a broad-based enterprise risk management process or more narrowly focused internal control process, risk assessment is a critical step in risk management. The risk heat map makes this easy to see and discover risk.

<Frame>
  <img alt="risk_heat_map.png" src="https://mintcdn.com/domoinc-openapi-sync-dataflows/DfXQTn5UA-Ig8rT5/images/kb/ka05w00000124QJ-00N5w00000Ri7BU-0EM5w000005vP2I.png?fit=max&auto=format&n=DfXQTn5UA-Ig8rT5&q=85&s=7d9cc190be246a2ca91ff59328ae51ce" width="936" height="410" data-path="images/kb/ka05w00000124QJ-00N5w00000Ri7BU-0EM5w000005vP2I.png" />
</Frame>

## Powering Risk Heat Maps

The risk heat map requires two categories and one value column. The categories usually represent the severity and likelihood of an event.

For information about value, category, and series data, see [Understanding Chart Data](/s/article/360043428693).

In Analyzer, you choose the columns containing the data for your risk heat map. For more information about choosing data columns, see [Applying DataSet Columns to Your Chart](/s/article/360043428713).

For more information about formatting charts in the Analyzer, see [Visualization Card Building Part 2: The Analyzer](/s/topic/0TO5w000000ZaoUGAS).

## Customizing Risk Heat Maps

You can customize the appearance of a risk heat map by editing its **Chart Properties**. For information about all chart properties, see [Chart Properties](/s/topic/0TO5w000000ZaodGAC).

Unique properties of a risk heat map include the following:

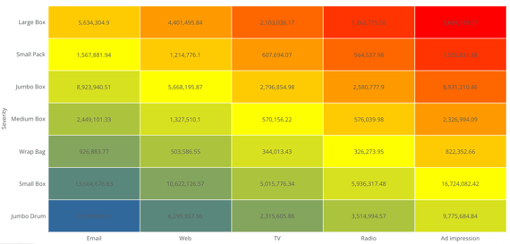
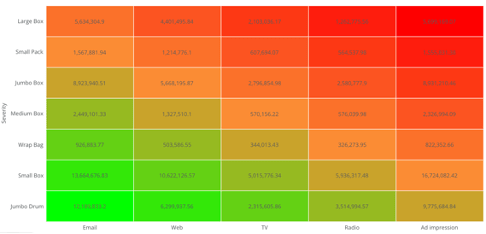
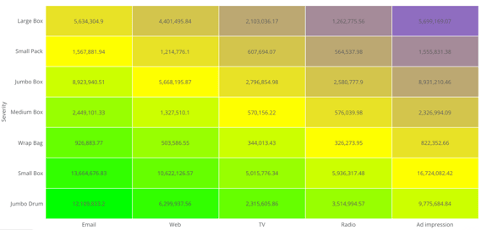
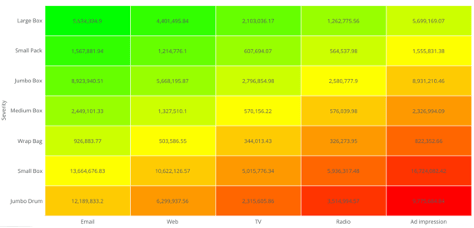
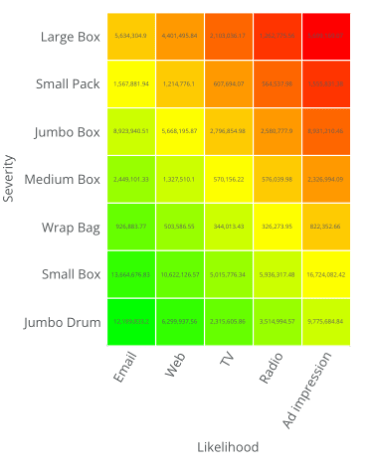
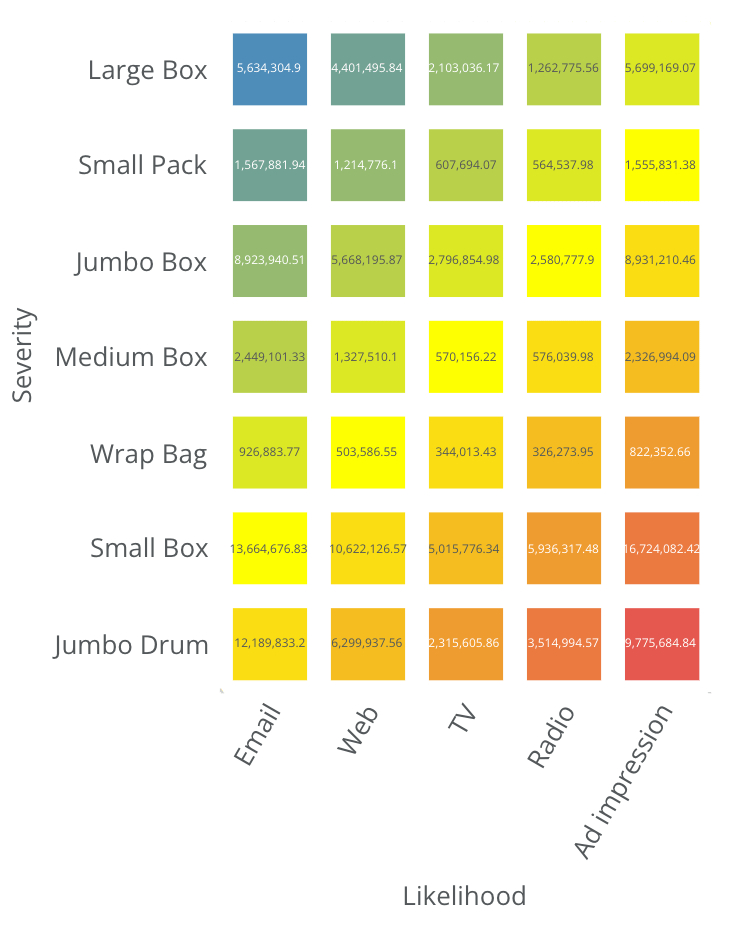
<table border="1" cellpadding="1" cellspacing="1" data-aura-rendered-by="33:202;a"><thead><tr><th colspan="1" rowspan="1"><p> Property </p></th><th colspan="1" rowspan="1"><p> Description </p></th><th colspan="1" rowspan="1"><p> Example </p></th></tr></thead><tbody><tr><td colspan="1" rowspan="1"><p> General > Low Color </p></td><td colspan="1" rowspan="1"><p> Sets the color for the low risk area. Default color is green. </p><p> In the example, the low color is blue. </p></td><td colspan="1" rowspan="1"><p class="wysiwyg-text-align-center"><img alt="low_color.png" src="https://mintcdn.com/domoinc-openapi-sync-dataflows/DfXQTn5UA-Ig8rT5/images/kb/ka05w00000124QJ-00N5w00000Ri7BU-0EM5w000005vP2N.png?fit=max&auto=format&n=DfXQTn5UA-Ig8rT5&q=85&s=43d8a8255cdb20bec6d14b72039513b8" width="510" height="244" data-path="images/kb/ka05w00000124QJ-00N5w00000Ri7BU-0EM5w000005vP2N.png" /></p></td></tr><tr><td colspan="1" rowspan="1"><p> General > Medium Color </p></td><td colspan="1" rowspan="1"><p> Sets the color for the low risk area. Default color is yellow. </p><p> In the example, the medium color is orange. </p></td><td colspan="1" rowspan="1"><p><span class="wysiwyg-color-black"><img alt="medium_color.png" src="https://mintcdn.com/domoinc-openapi-sync-dataflows/DfXQTn5UA-Ig8rT5/images/kb/ka05w00000124QJ-00N5w00000Ri7BU-0EM5w000005vP2H.png?fit=max&auto=format&n=DfXQTn5UA-Ig8rT5&q=85&s=1a0c821f3090501d5a73c71a16c05792" width="486" height="234" data-path="images/kb/ka05w00000124QJ-00N5w00000Ri7BU-0EM5w000005vP2H.png" /></span></p></td></tr><tr><td colspan="1" rowspan="1"><p> General > High Color </p></td><td colspan="1" rowspan="1"><p> Sets the color for the low risk area. Default color is red. </p><p> In the example, the high color is purple. </p></td><td colspan="1" rowspan="1"><p class="wysiwyg-text-align-center"><img alt="high_color.png" src="https://mintcdn.com/domoinc-openapi-sync-dataflows/DfXQTn5UA-Ig8rT5/images/kb/ka05w00000124QJ-00N5w00000Ri7BU-0EM5w000005vP2L.png?fit=max&auto=format&n=DfXQTn5UA-Ig8rT5&q=85&s=ab35579fcb3019ef08e28148ec381256" width="482" height="230" data-path="images/kb/ka05w00000124QJ-00N5w00000Ri7BU-0EM5w000005vP2L.png" /></p></td></tr><tr><td colspan="1" rowspan="1"><p> General > Invert Colors </p></td><td colspan="1" rowspan="1"><p> Changes from top-left base to bottom-right base. </p></td><td colspan="1" rowspan="1"><p /><p class="wysiwyg-text-align-center"><img alt="invert_colors.png" src="https://mintcdn.com/domoinc-openapi-sync-dataflows/DfXQTn5UA-Ig8rT5/images/kb/ka05w00000124QJ-00N5w00000Ri7BU-0EM5w000005vP2K.png?fit=max&auto=format&n=DfXQTn5UA-Ig8rT5&q=85&s=5f6a1753d10f6260c9e8dfa0f7736020" width="474" height="228" data-path="images/kb/ka05w00000124QJ-00N5w00000Ri7BU-0EM5w000005vP2K.png" /></p><p /></td></tr><tr><td colspan="1" rowspan="1"><p> General > Square Cells </p></td><td colspan="1" rowspan="1"><p> Keeps all grid cells square even when the table area is skewed. </p></td><td colspan="1" rowspan="1"><p class="wysiwyg-text-align-center" /><p class="wysiwyg-text-align-center"><img alt="square_cells.png" src="https://mintcdn.com/domoinc-openapi-sync-dataflows/DfXQTn5UA-Ig8rT5/images/kb/ka05w00000124QJ-00N5w00000Ri7BU-0EM5w000005vP2S.png?fit=max&auto=format&n=DfXQTn5UA-Ig8rT5&q=85&s=fb657c59f70215b0f19d66f177e081bb" width="374" height="470" data-path="images/kb/ka05w00000124QJ-00N5w00000Ri7BU-0EM5w000005vP2S.png" /></p><p /></td></tr><tr><td colspan="1" rowspan="1"><p> General > Inner Margin </p></td><td colspan="1" rowspan="1"><p> Margin space used. This is the space between the colored cells. </p></td><td colspan="1" rowspan="1"><p><img alt="inner_margin.png" src="https://mintcdn.com/domoinc-openapi-sync-dataflows/DfXQTn5UA-Ig8rT5/images/kb/ka05w00000124QJ-00N5w00000Ri7BU-0EM5w000005vP2M.png?fit=max&auto=format&n=DfXQTn5UA-Ig8rT5&q=85&s=3d1844b928b84f6911fff9b52fff3fee" width="748" height="940" data-path="images/kb/ka05w00000124QJ-00N5w00000Ri7BU-0EM5w000005vP2M.png" /></p></td></tr></tbody></table>